
B2C
Growth
Shipped
Improving car cards
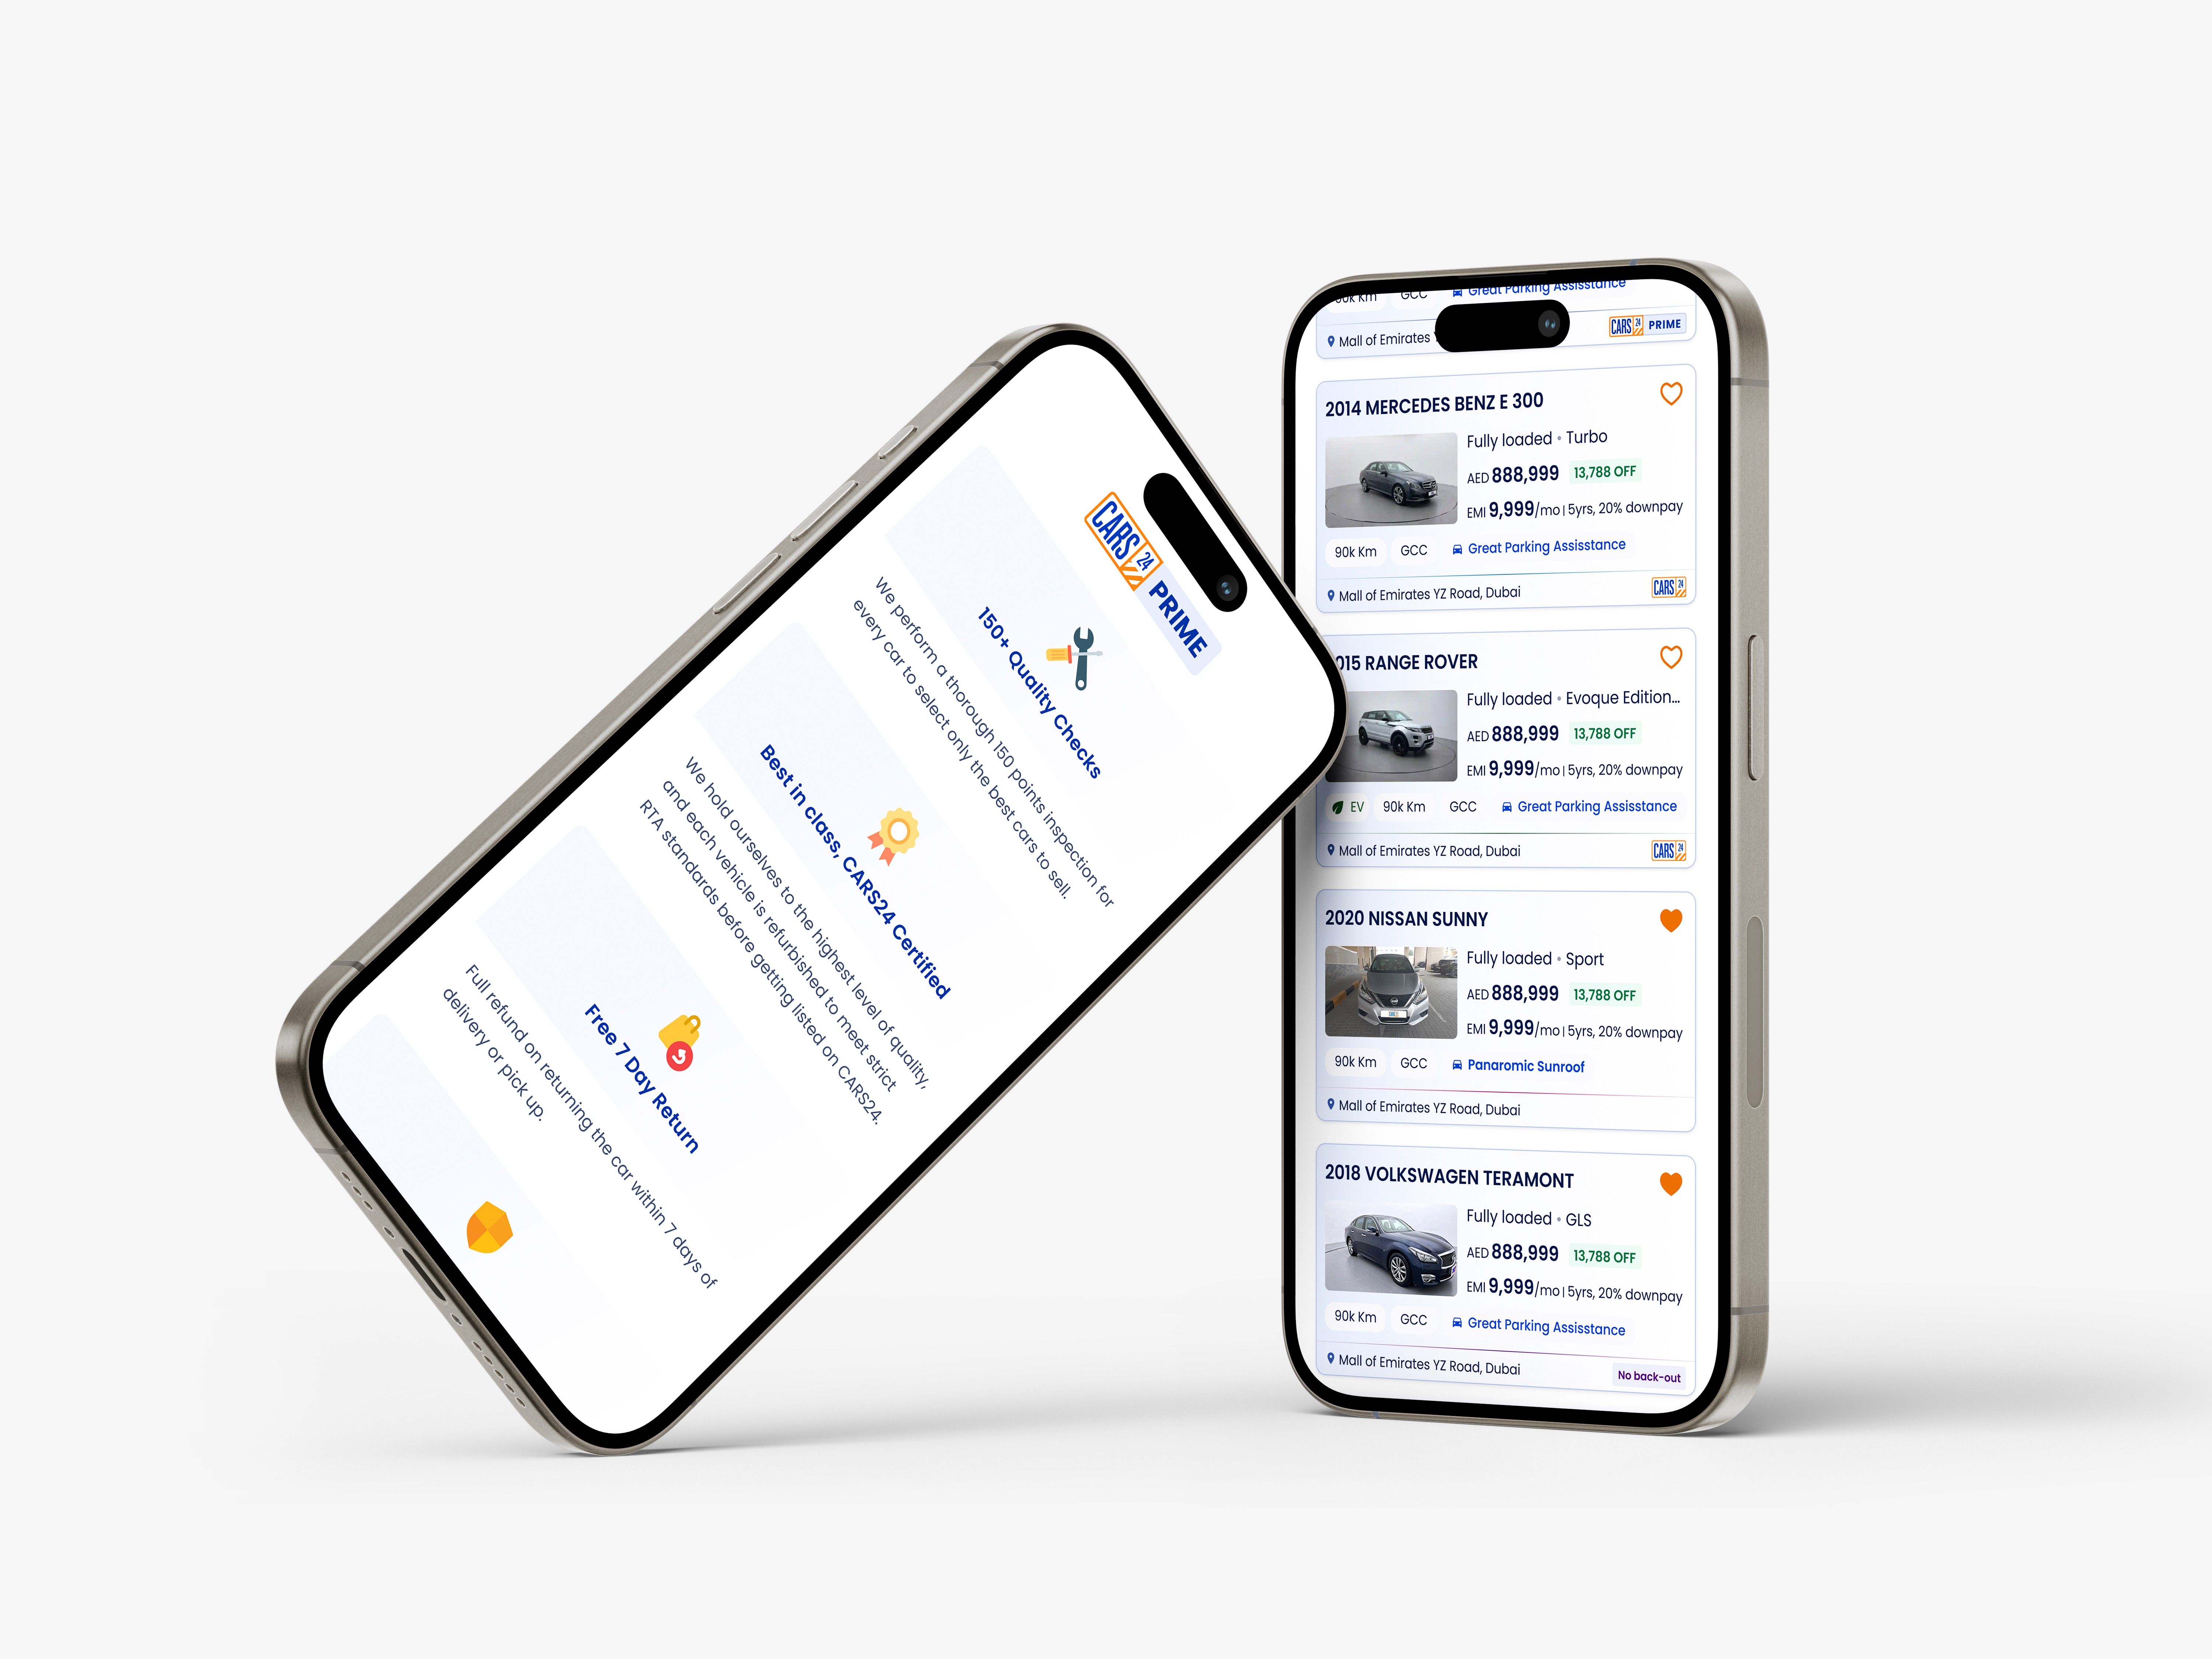
An overhaul of the car cards, how cars are classified, and how each subcategory's benefits are presented to the customer, relying on recognition over recall.
Role
Lead
Duration
3 months
Format
Research + sprint
Team size
3
Why?
Old cards are overly compact, and cause readability issues.
Text heavy static pages confuse users
Confusing tag system reliant on recall over recognition
How?
A redesign of the layout and visual hierarchy of the car cards
Simpler and fewer static page callouts
A better, more readable tag system, that creates curiosity
Who?
All customers on the Cars24 platform. 98% of users do not interact with the car tag.
Insignificant number of customers are aware of the tags and their meanings.
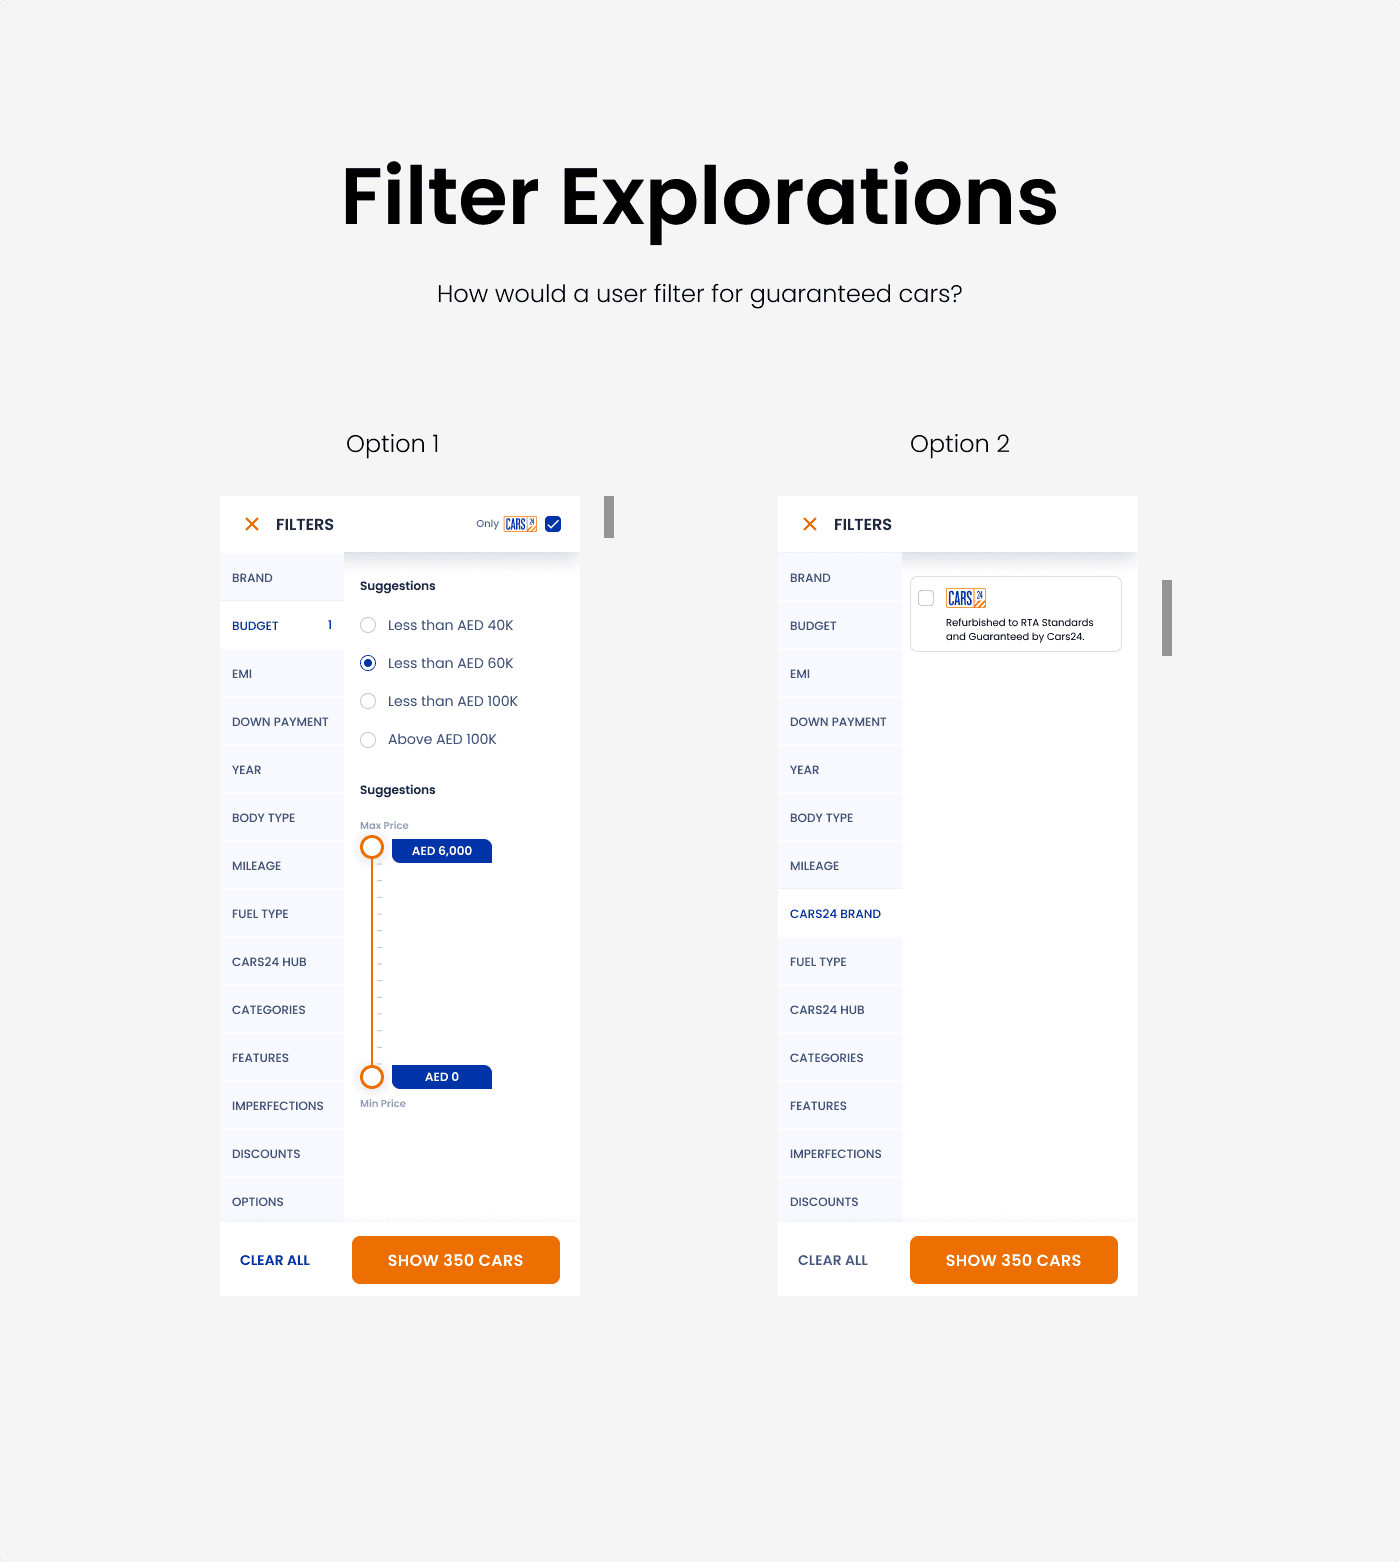
Customers who want to filter higher quality cars exclusively.
What?
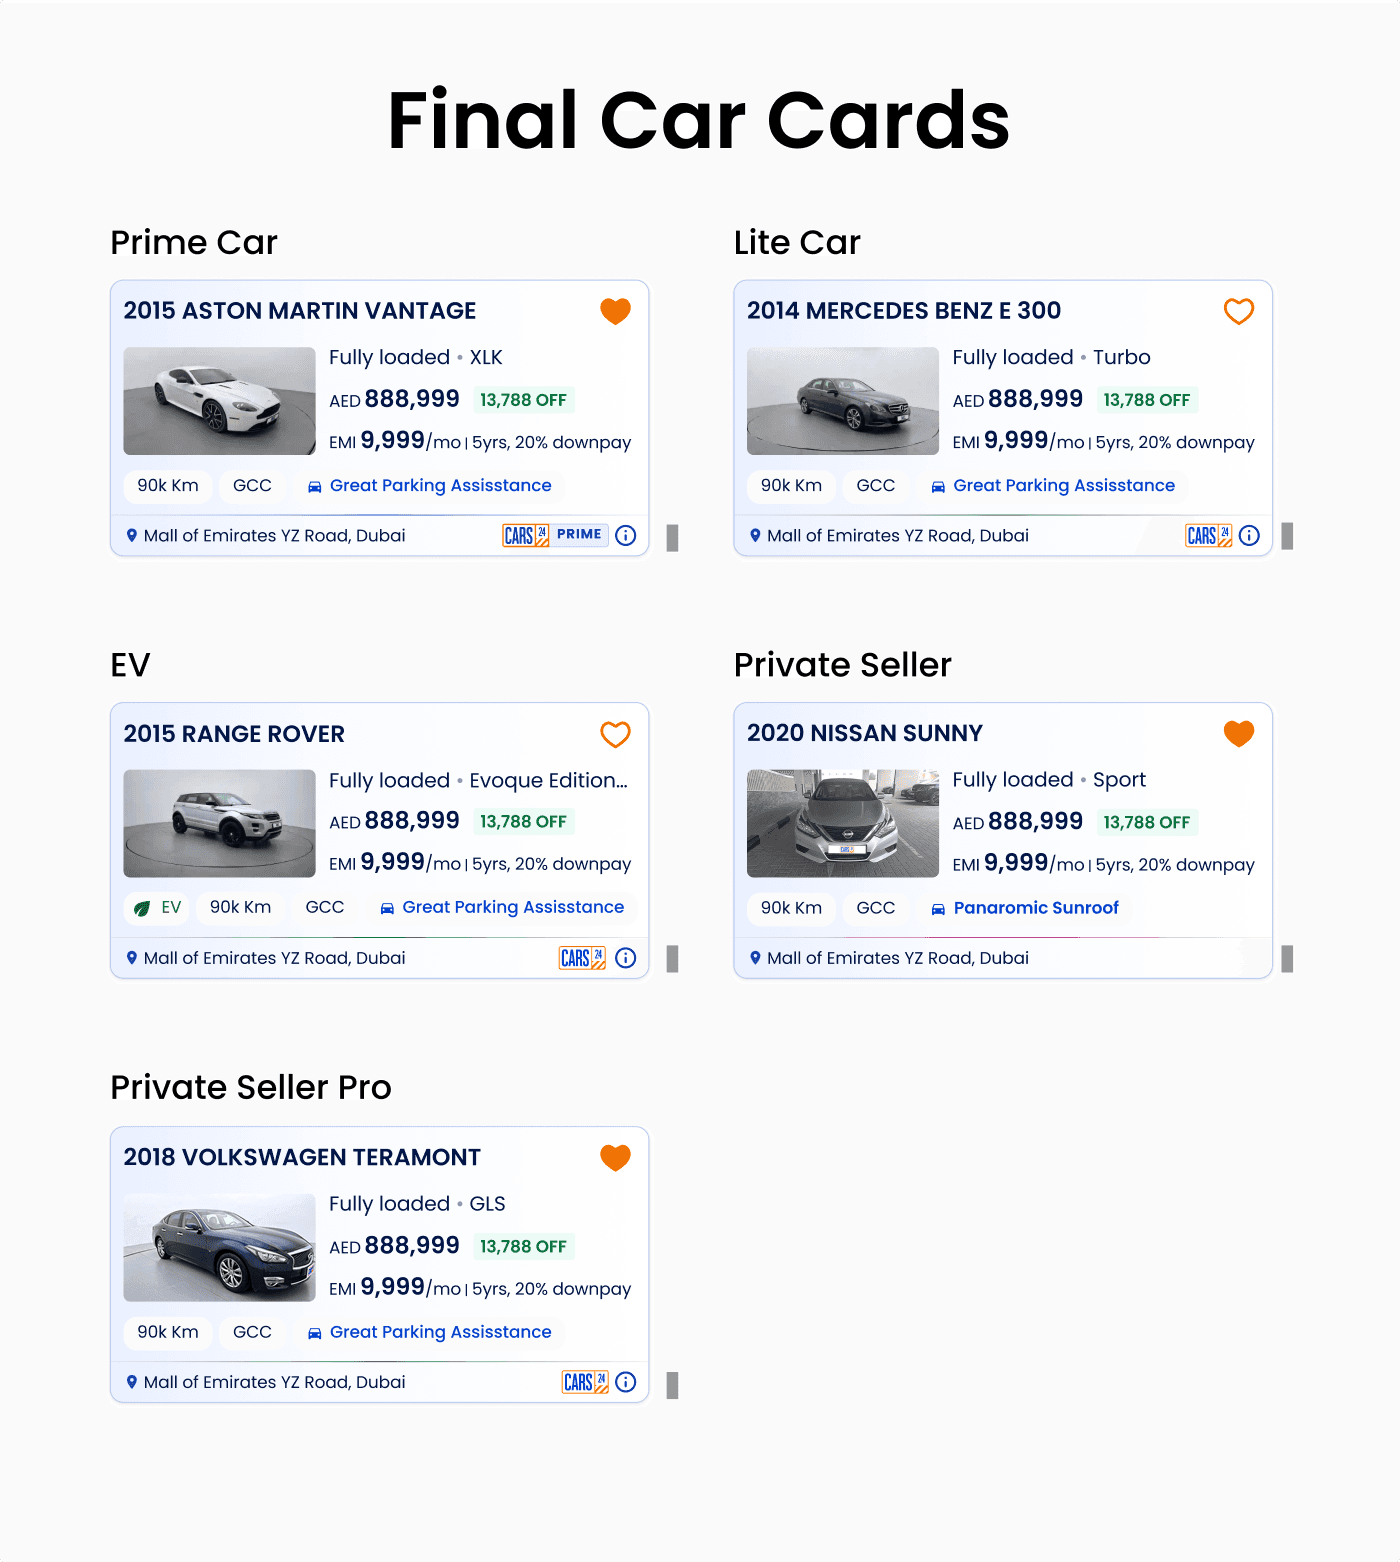
Aiming for simplicity, and only showing the ultimate selling points.
Reducing overall volumes of text to be consumed - and reducing line items
Empowering users to use this classification system to find higher quality cars faster.
145%
more clicks on tags
23%
increase in bookings initiated
60%
more static page visits
Context
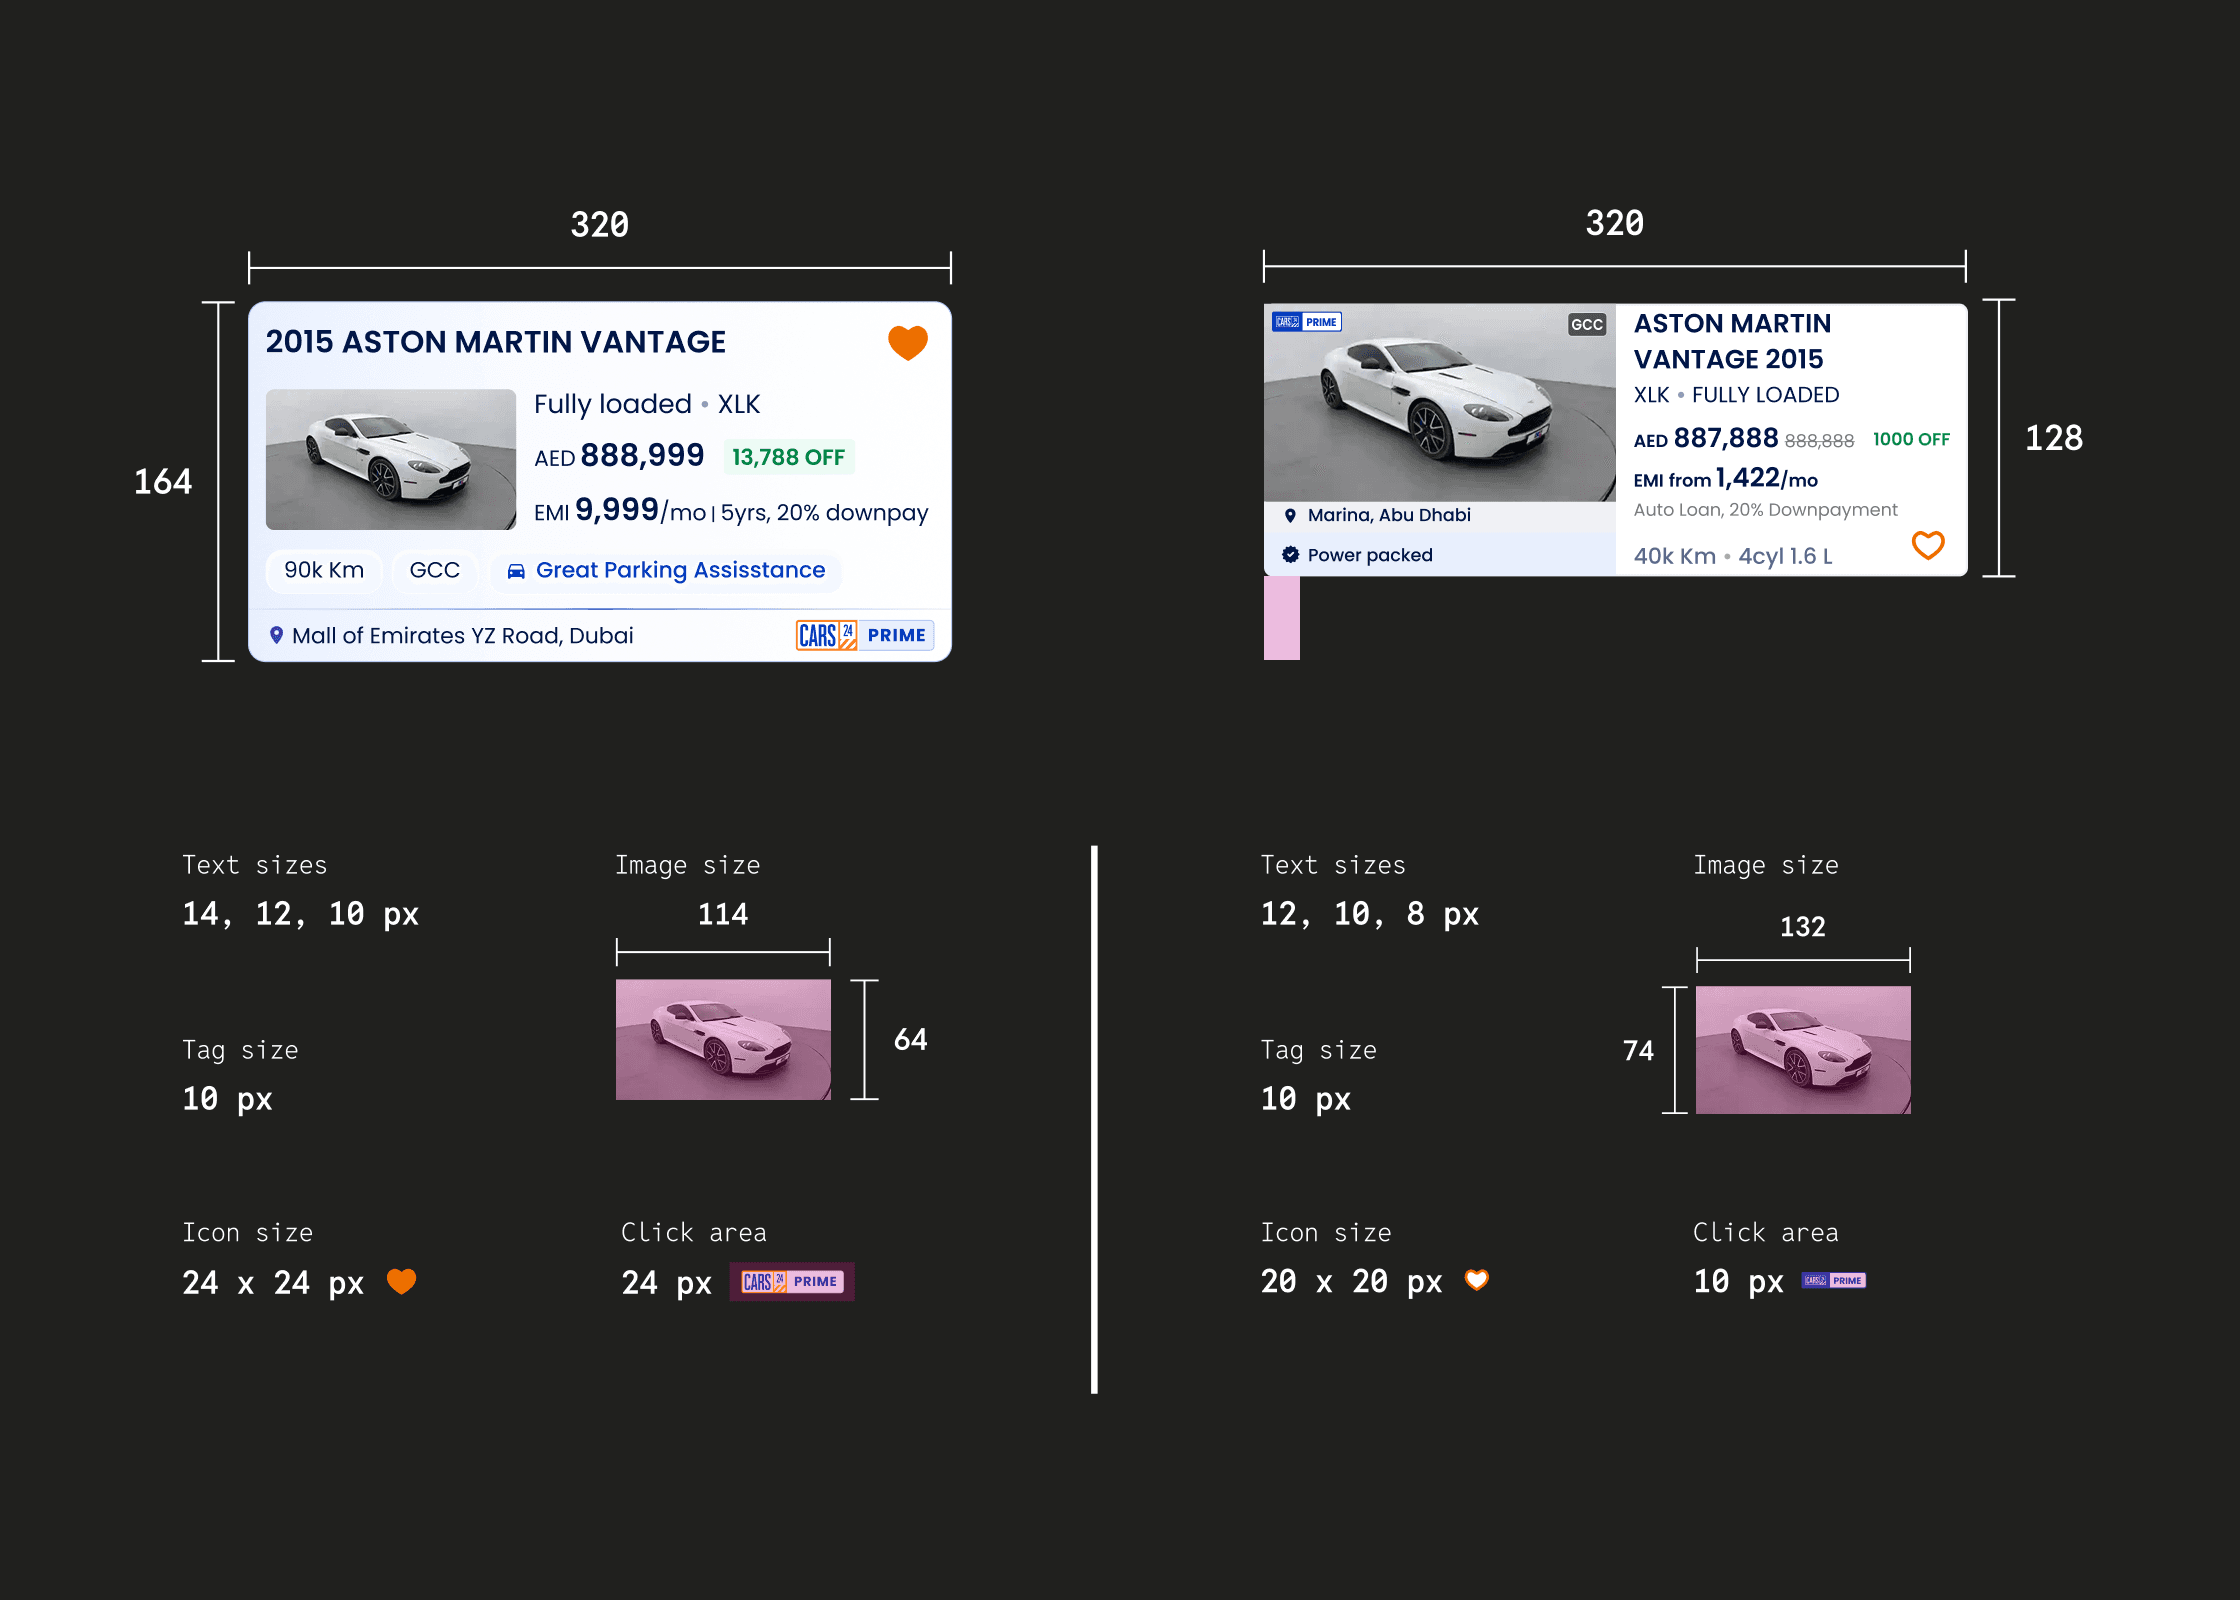
Car cards are the first point of contact a user has with the platform. The information presented here poses unique constraints - the more cars the user sees, the more likely they are to buy a car - leading to the conclusion that vertical space occupied by a card should be minimised. However, business, marketing, legal, and tech constraints require certain information to be present as a minimum. With not much freedom to cull information, layout of the car car was our first priority.
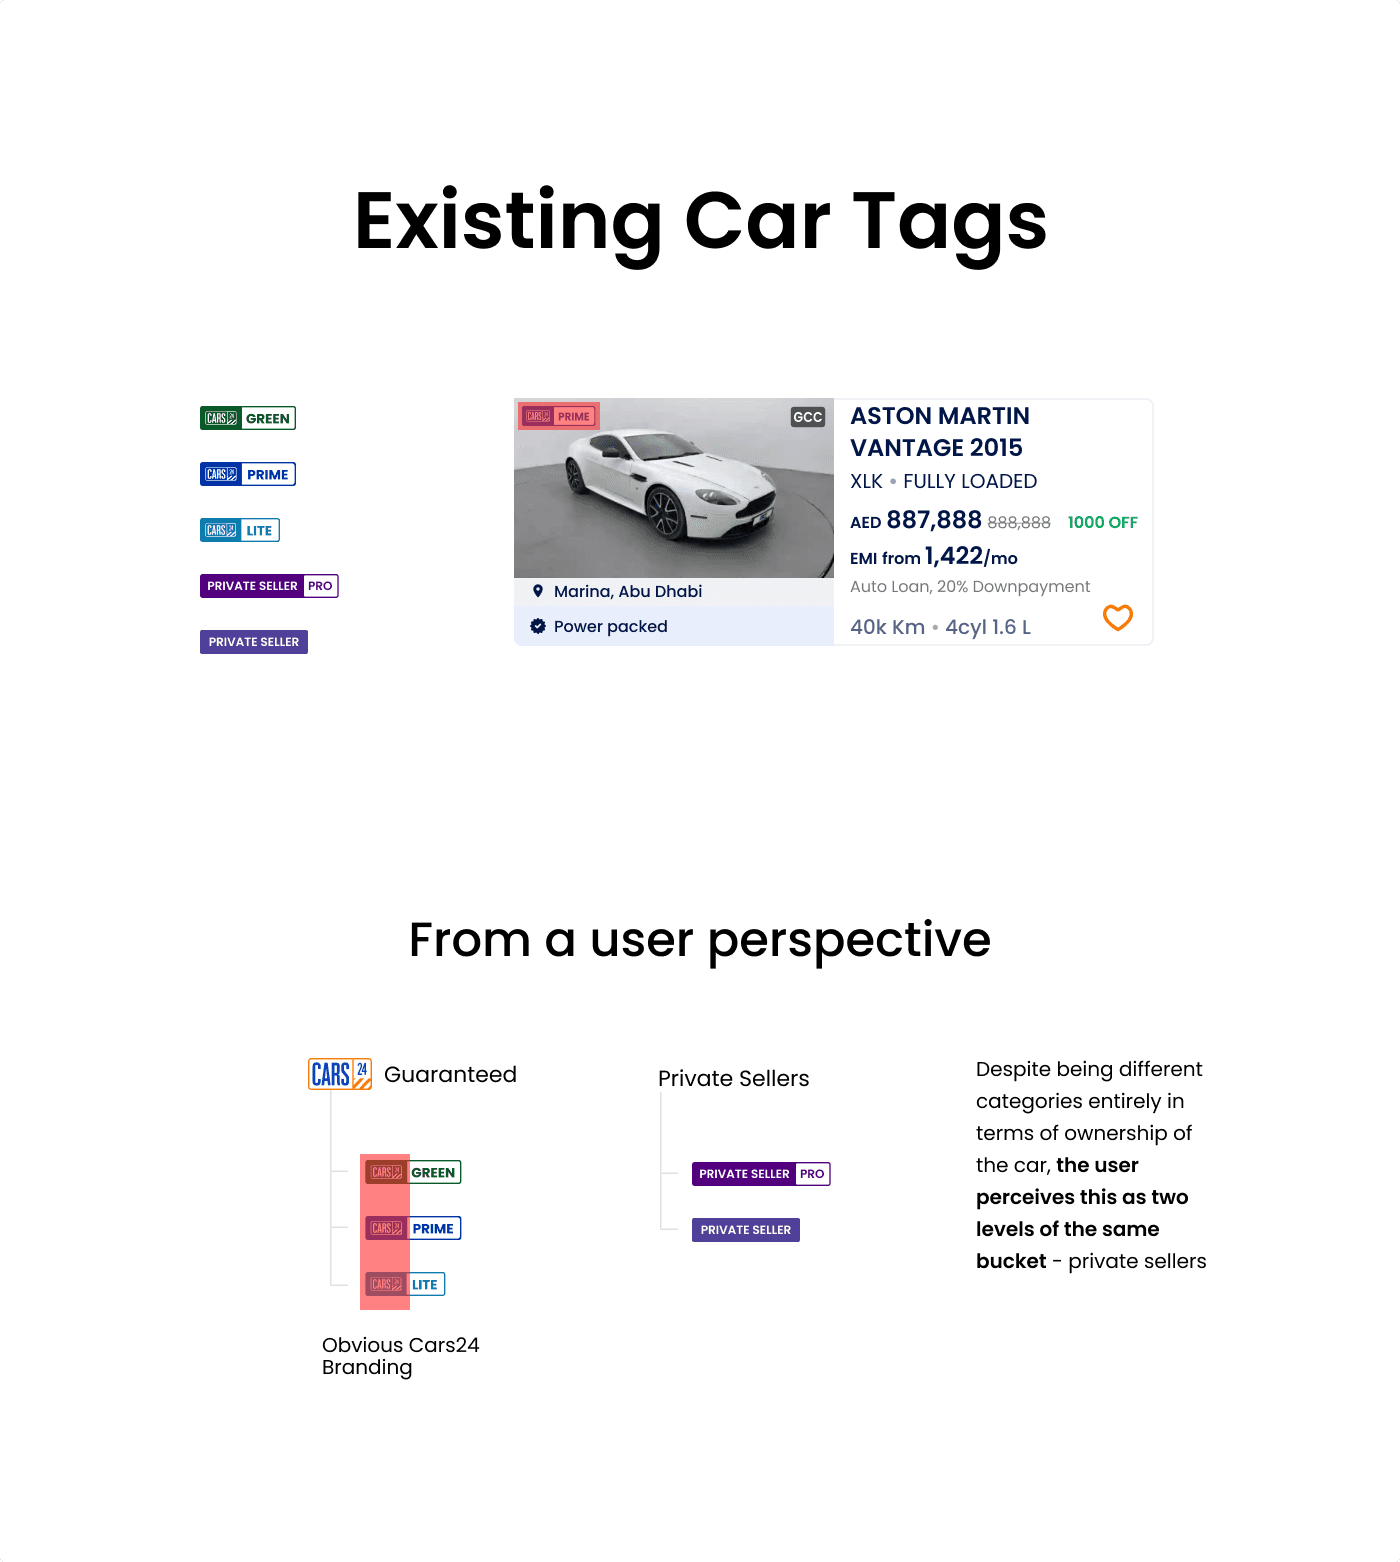
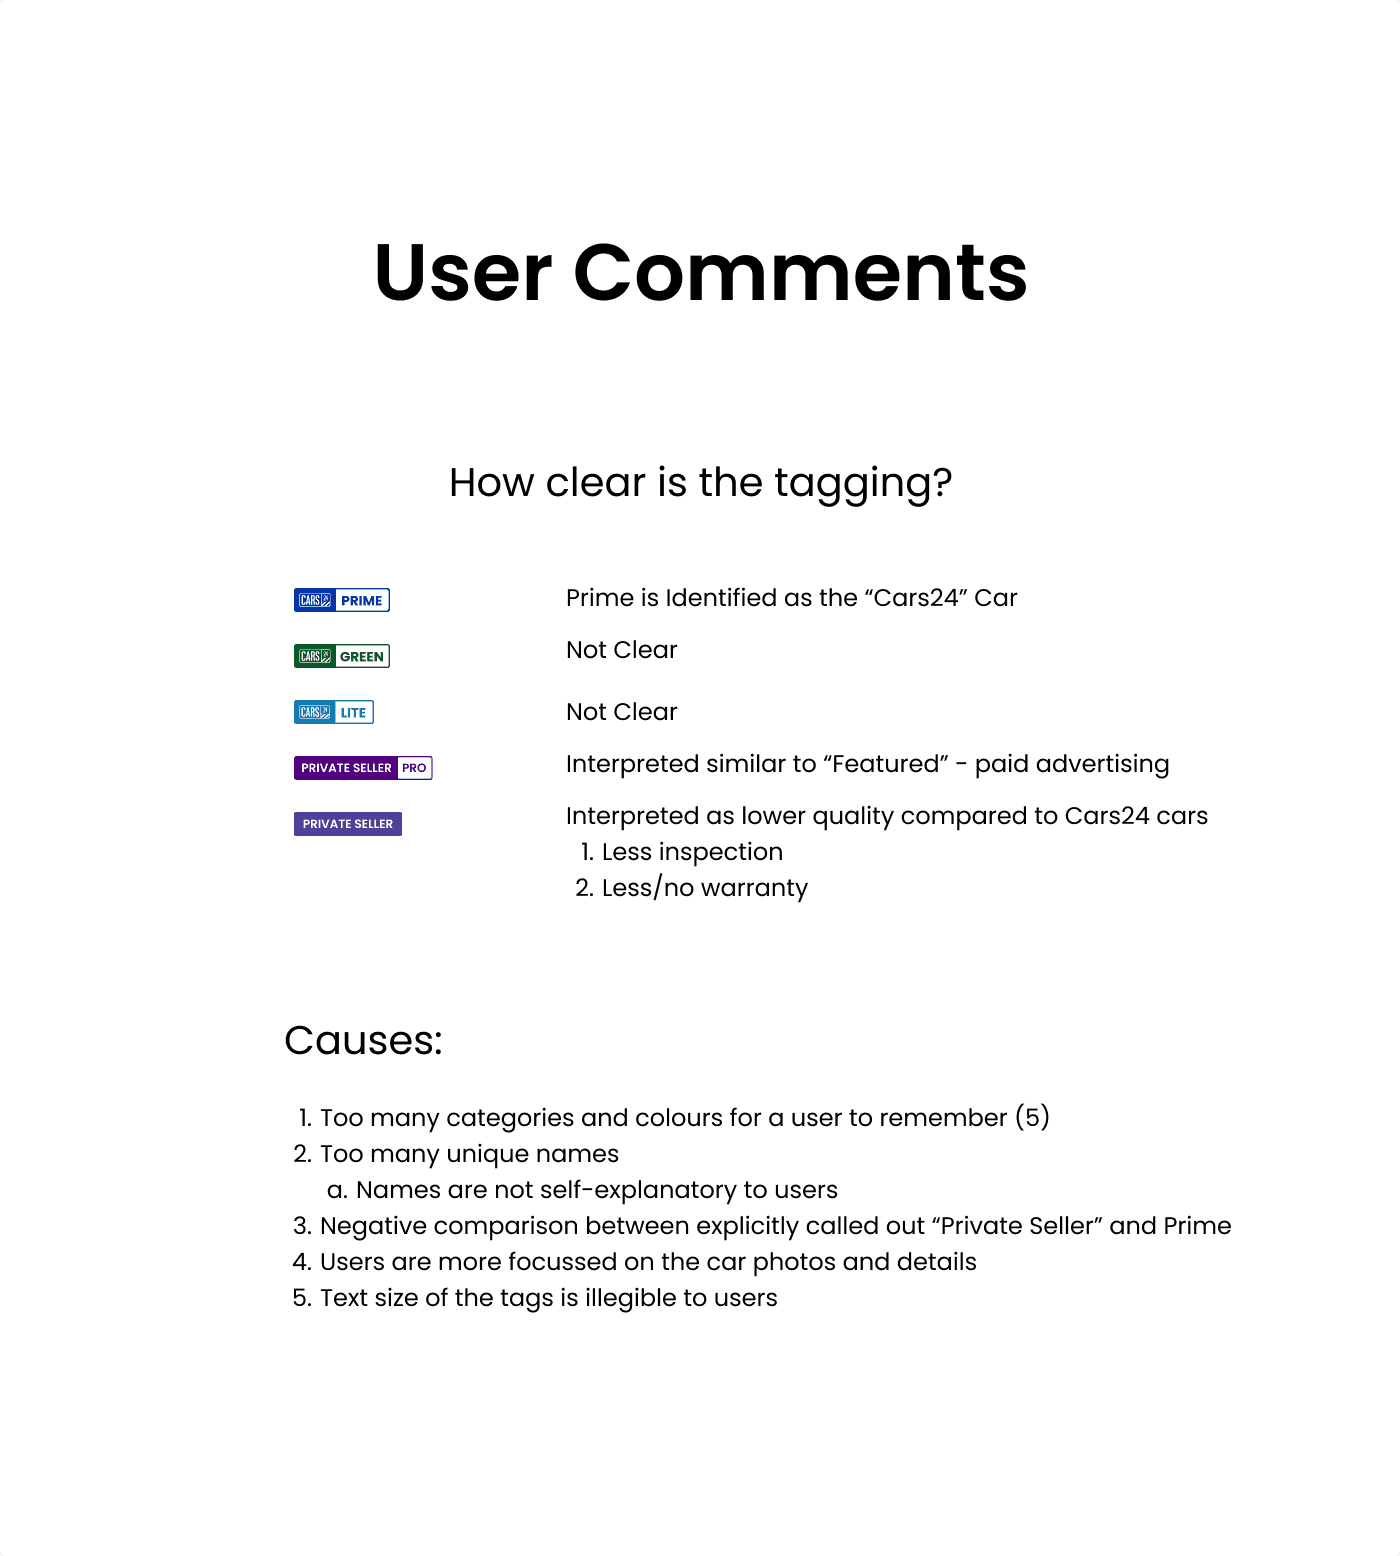
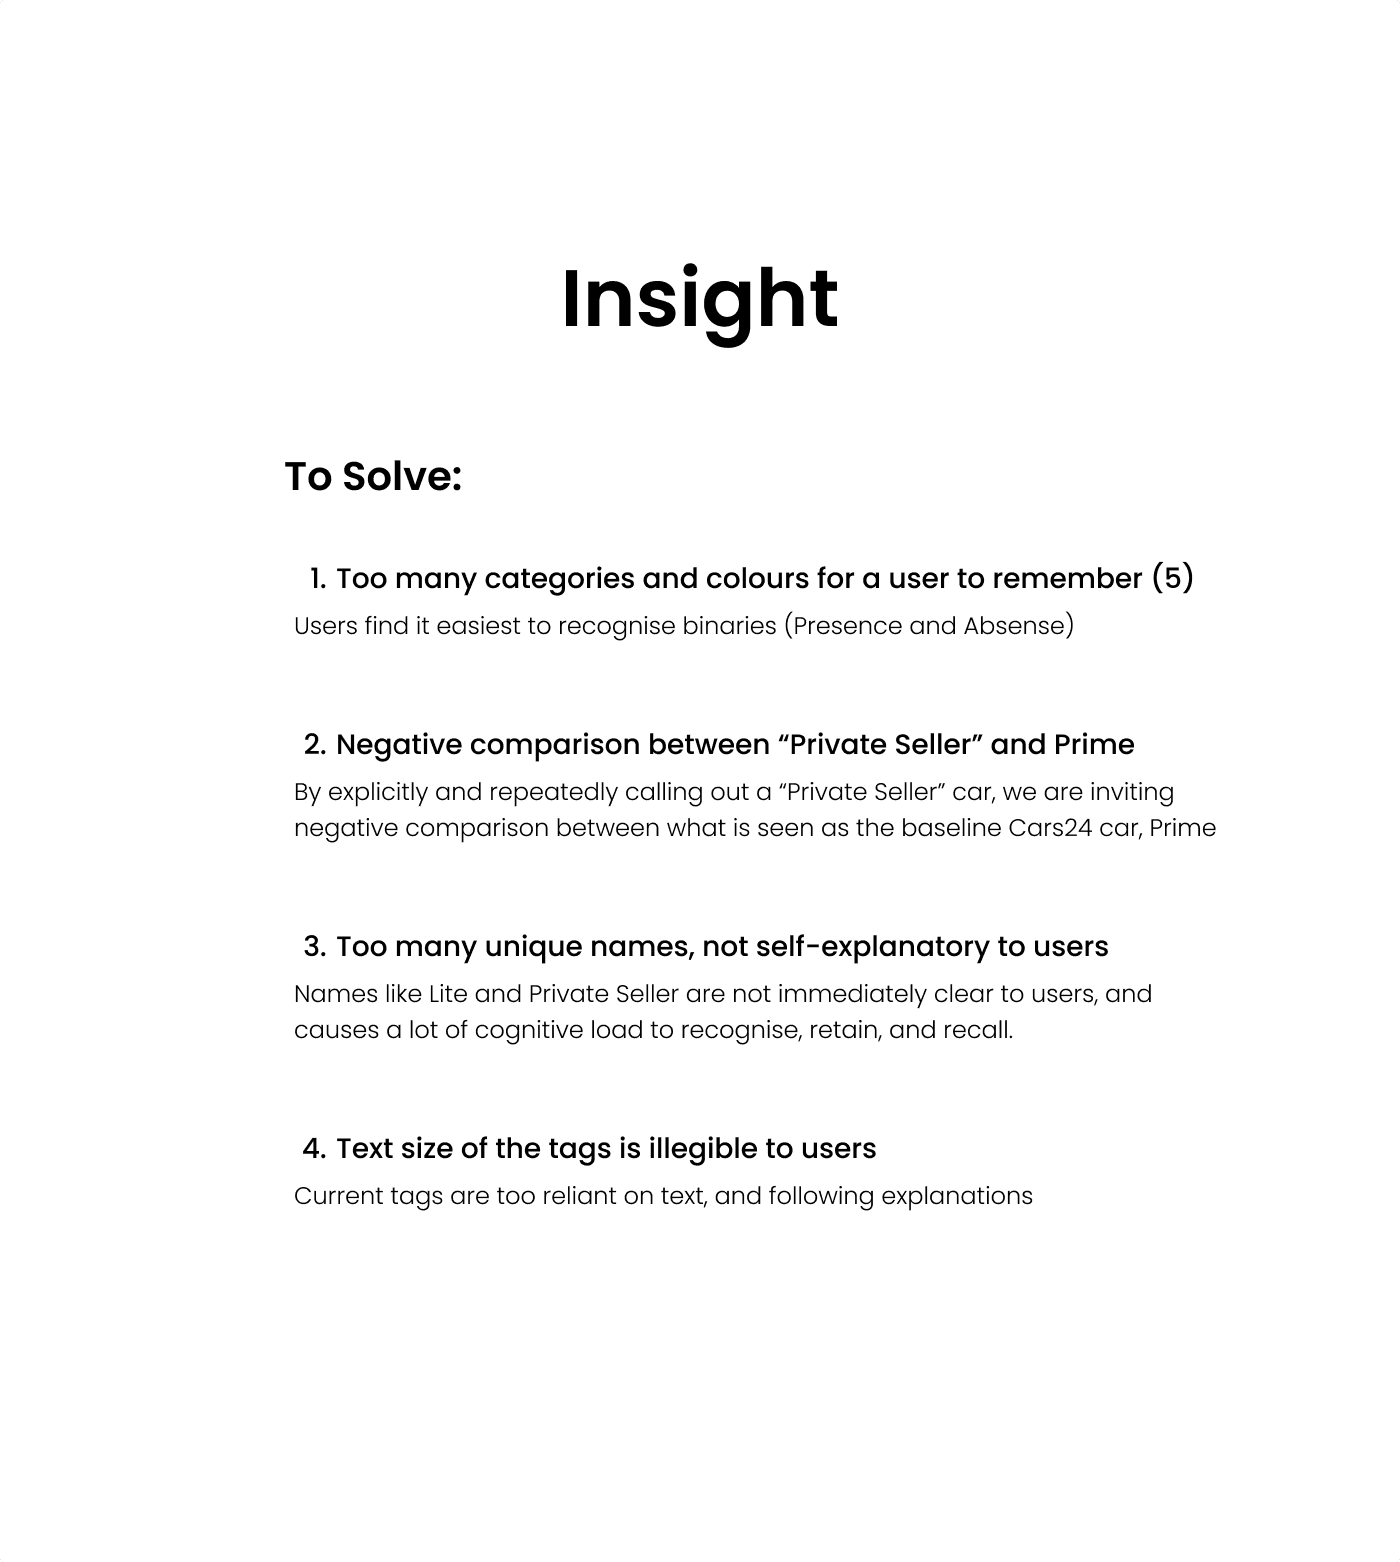
The tag system originally comprised five categories: Cars24 Prime, Cars24 Green, Cars24 Lite, Private Seller, and Private Seller Pro. Confused? You're not alone. Each tag was associated with a unique colour - relying on recall rather than recognition. This added cognitive load to the user, without any perceived benefit. Simplifying the tag system became the second method to improve experience.
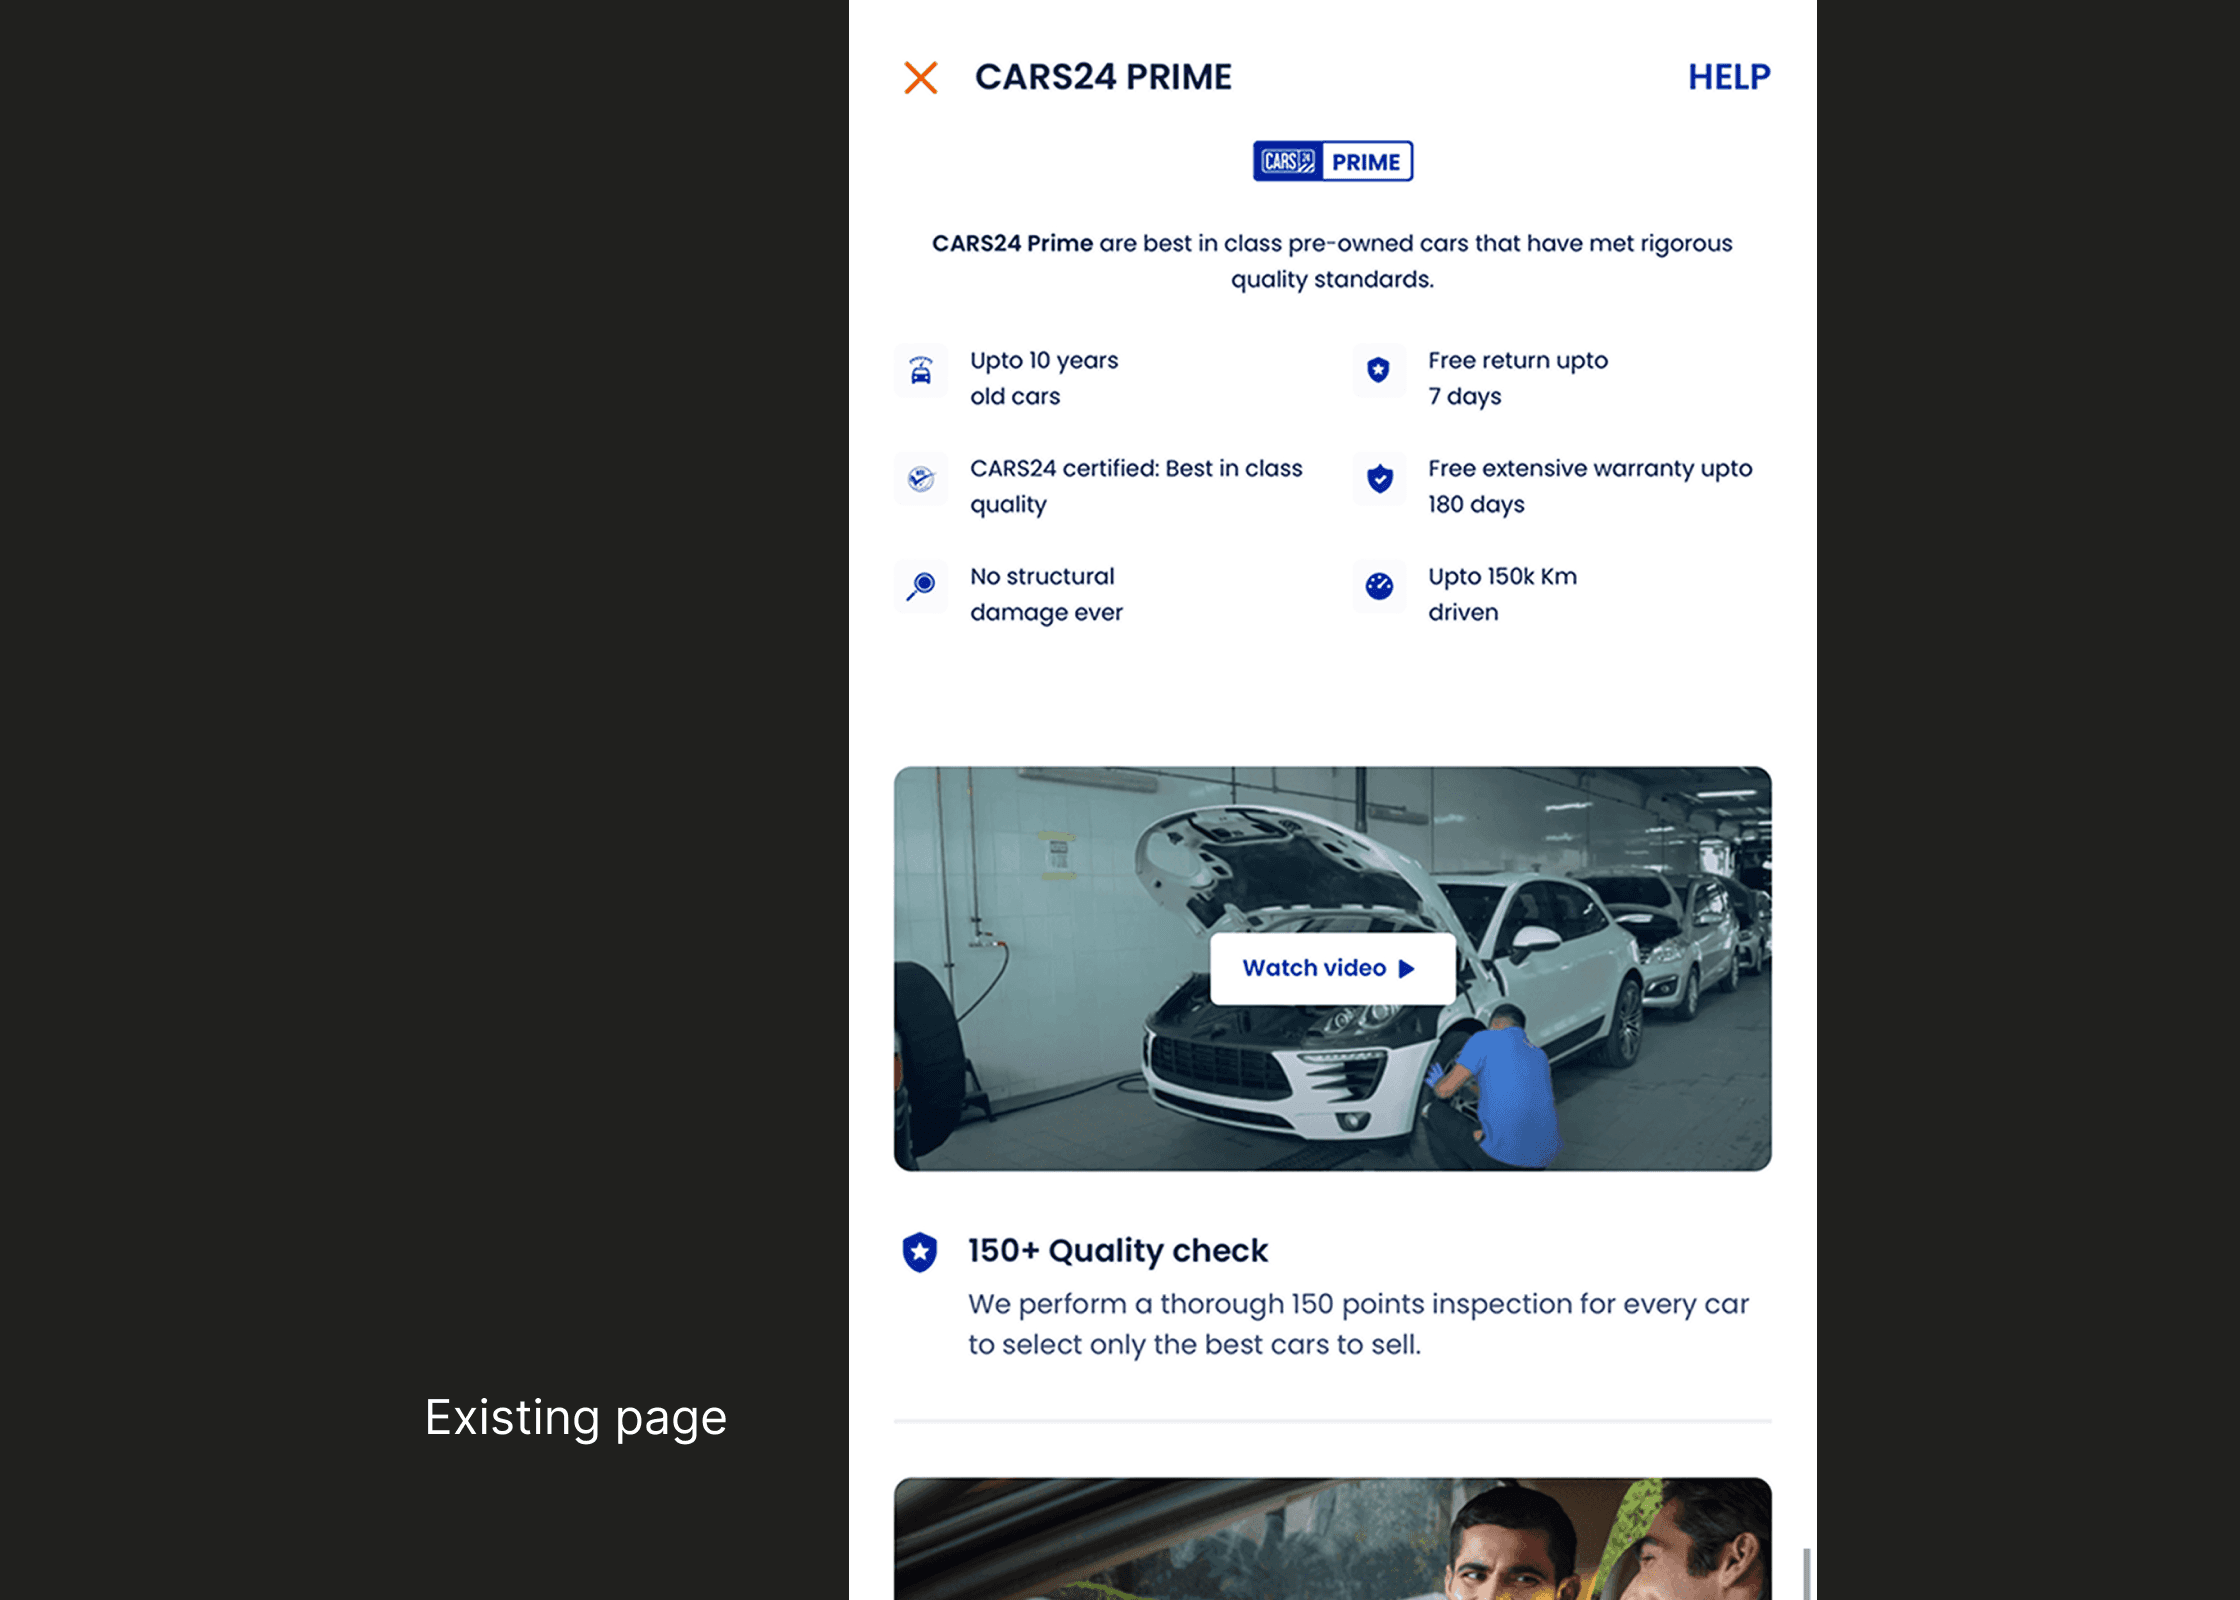
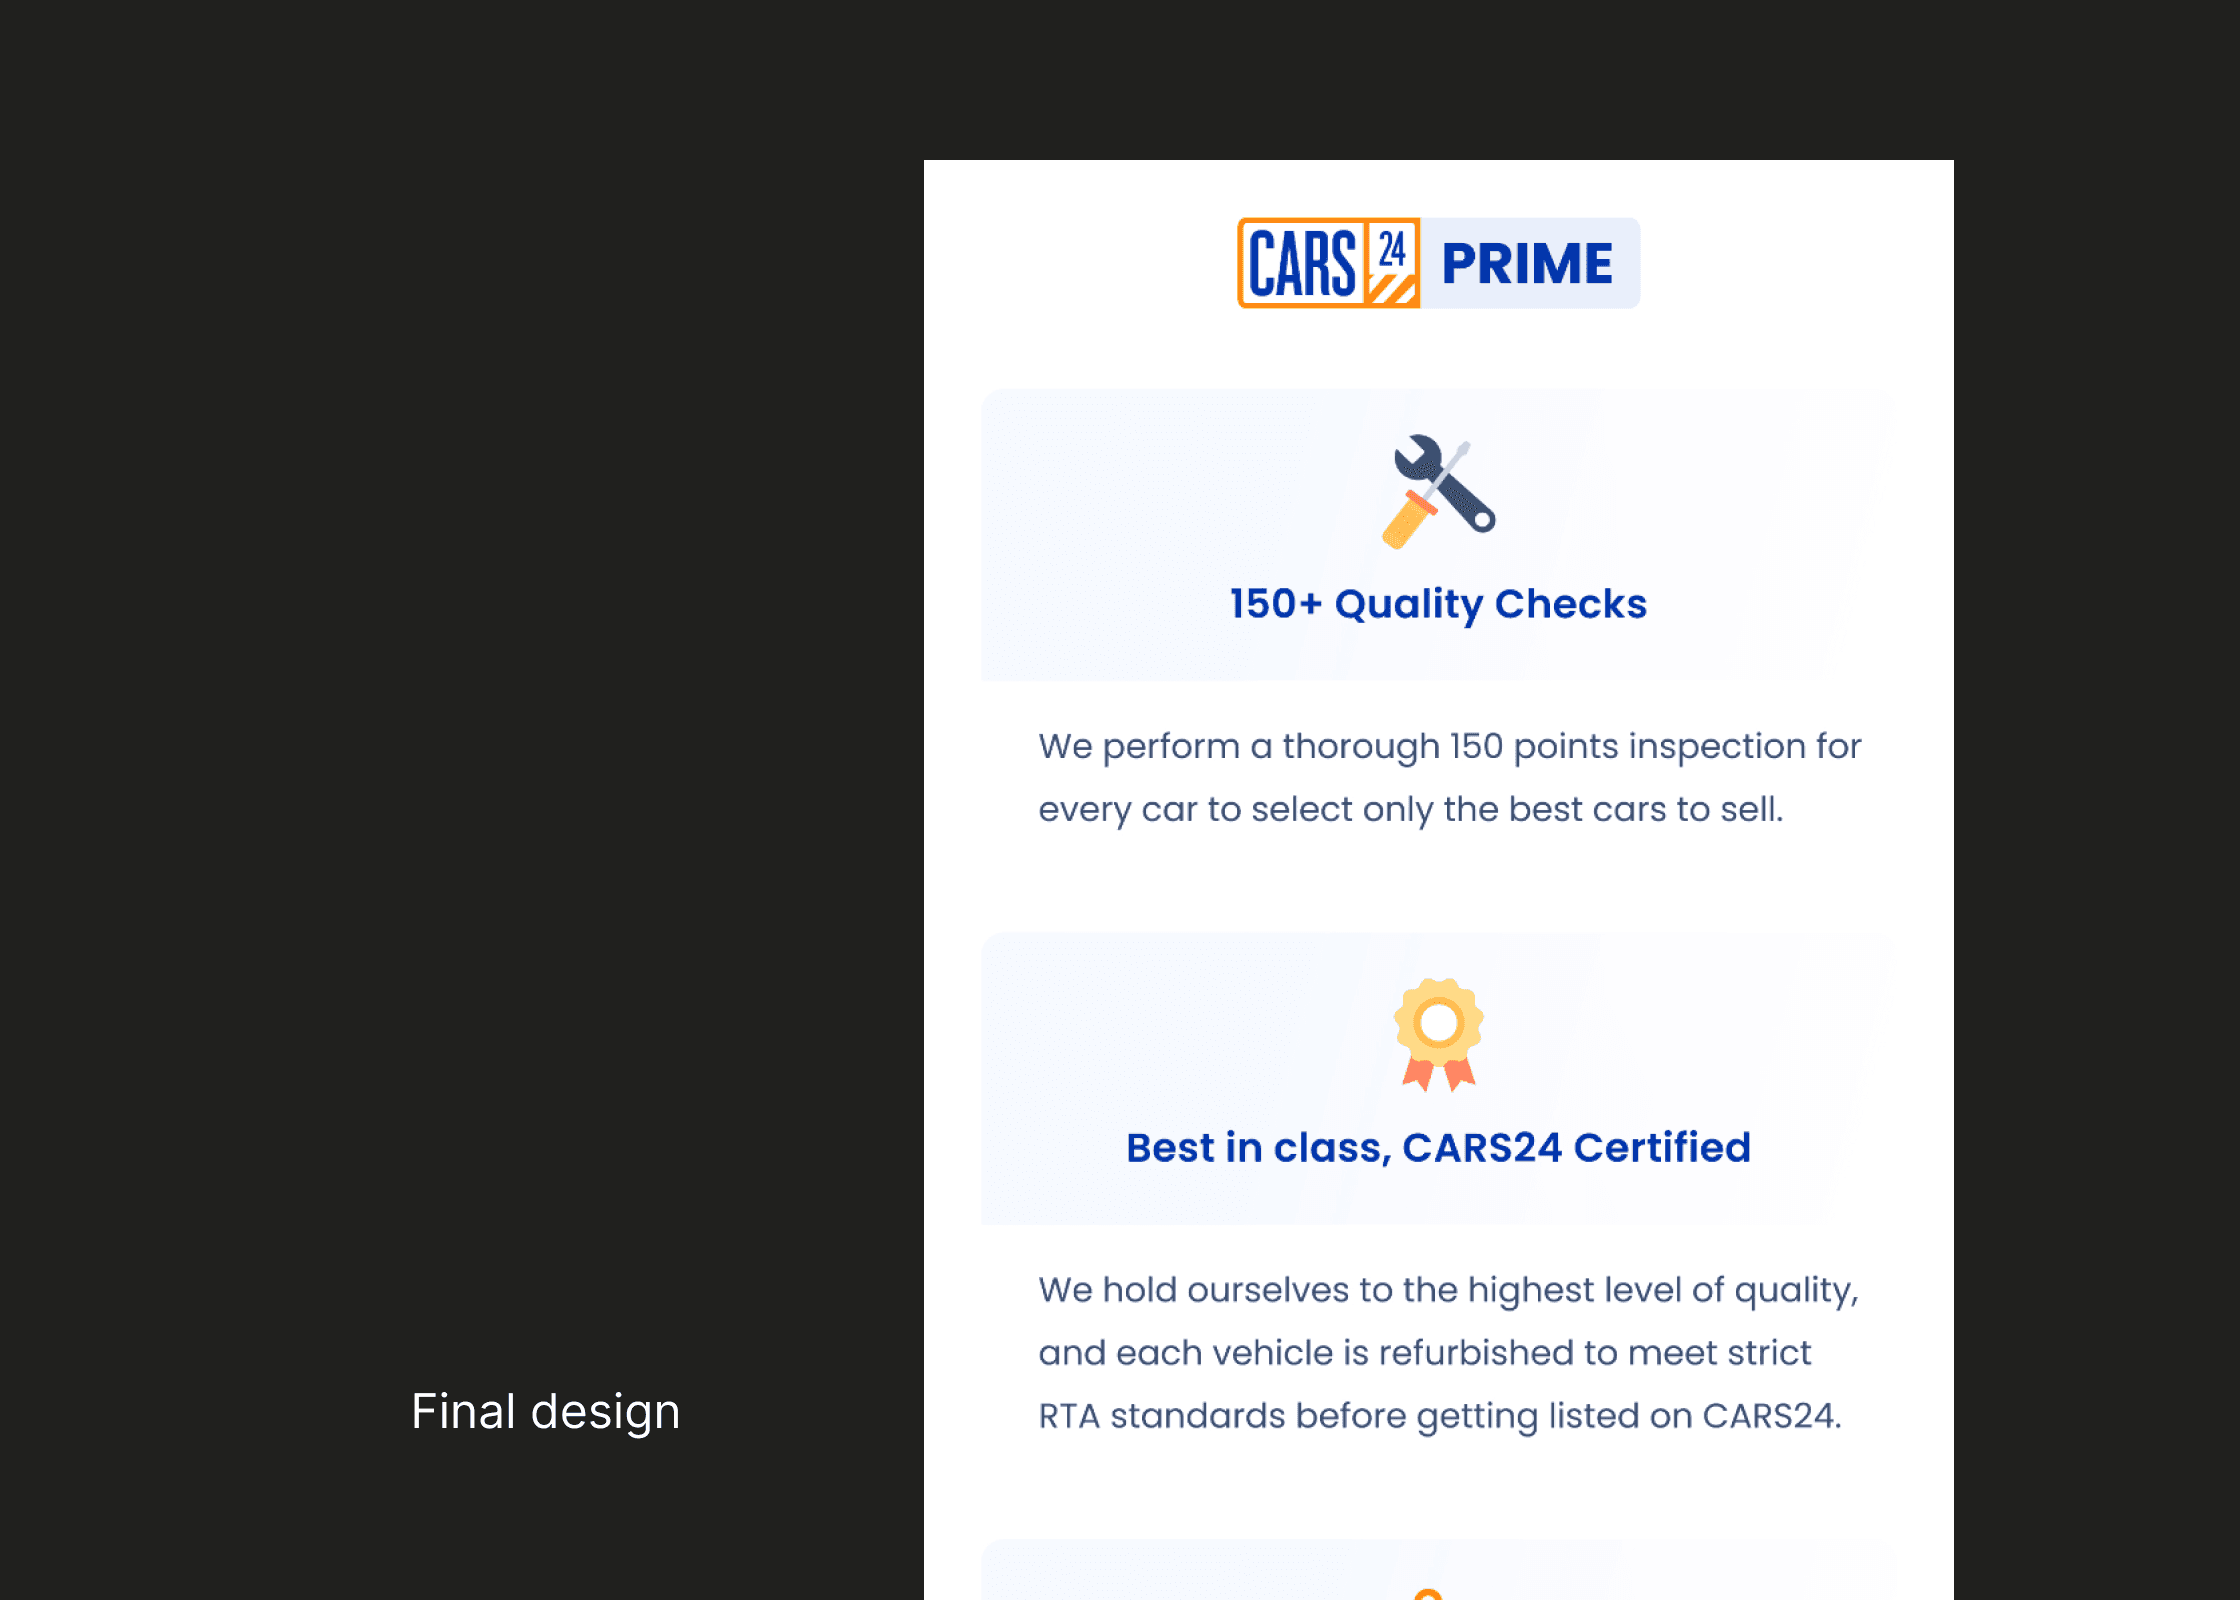
Static pages were the simplest - with strict legal requirements for certain terminology and specific callouts to be present on the page, I only had the freedom to improve the visual design. Reducing the number of USP's. and replacing photos with icons gave the page some much-needed breathing space. This became the final piece in our proverbial puzzle.
Opportunity
Redesigning the car cards, car tags, and static pages addresses key usability challenges by streamlining visual hierarchy, classification, and content clarity. Our research revealed that overly compact car cards obscure critical details, while inconsistent, color-coded tags and text-heavy static pages confuse users and hinder engagement. By rebalancing space on car cards, creating a coherent, intuitive tagging system, and simplifying static pages with user-relevant visuals and progressive disclosure, the redesign aims to enhance discoverability and navigation.
Outcome
The redesigned car cards increased impressions per user by 26%, detail page visits by 19%, and booking intent by 11%, reducing decision paralysis and improving browsing efficiency. While iterations balanced aesthetics with business and regulatory constraints, user feedback confirmed enhanced usability. The new tagging system boosted tag clicks by 145% and increased static page views from 4% to 23%, with customer queries about tag meanings dropping 31%, validating improved clarity. Redesigned static pages led to a 12% rise in booking intent, with 60% of users scrolling for more details and 35% engaging with multiple pages, showing improved discoverability and navigation.
Problem statement
1. For Car Cards: To improve readability and visual hierarchy of information. More clickable car tags.
2. For Car Tags : To simplify the categorisation system, and allow users to filter the best offerings on Cars24.
3. For Static pages: To make static pages more visually appealing, and simplify information presented.
Process
Car Cards
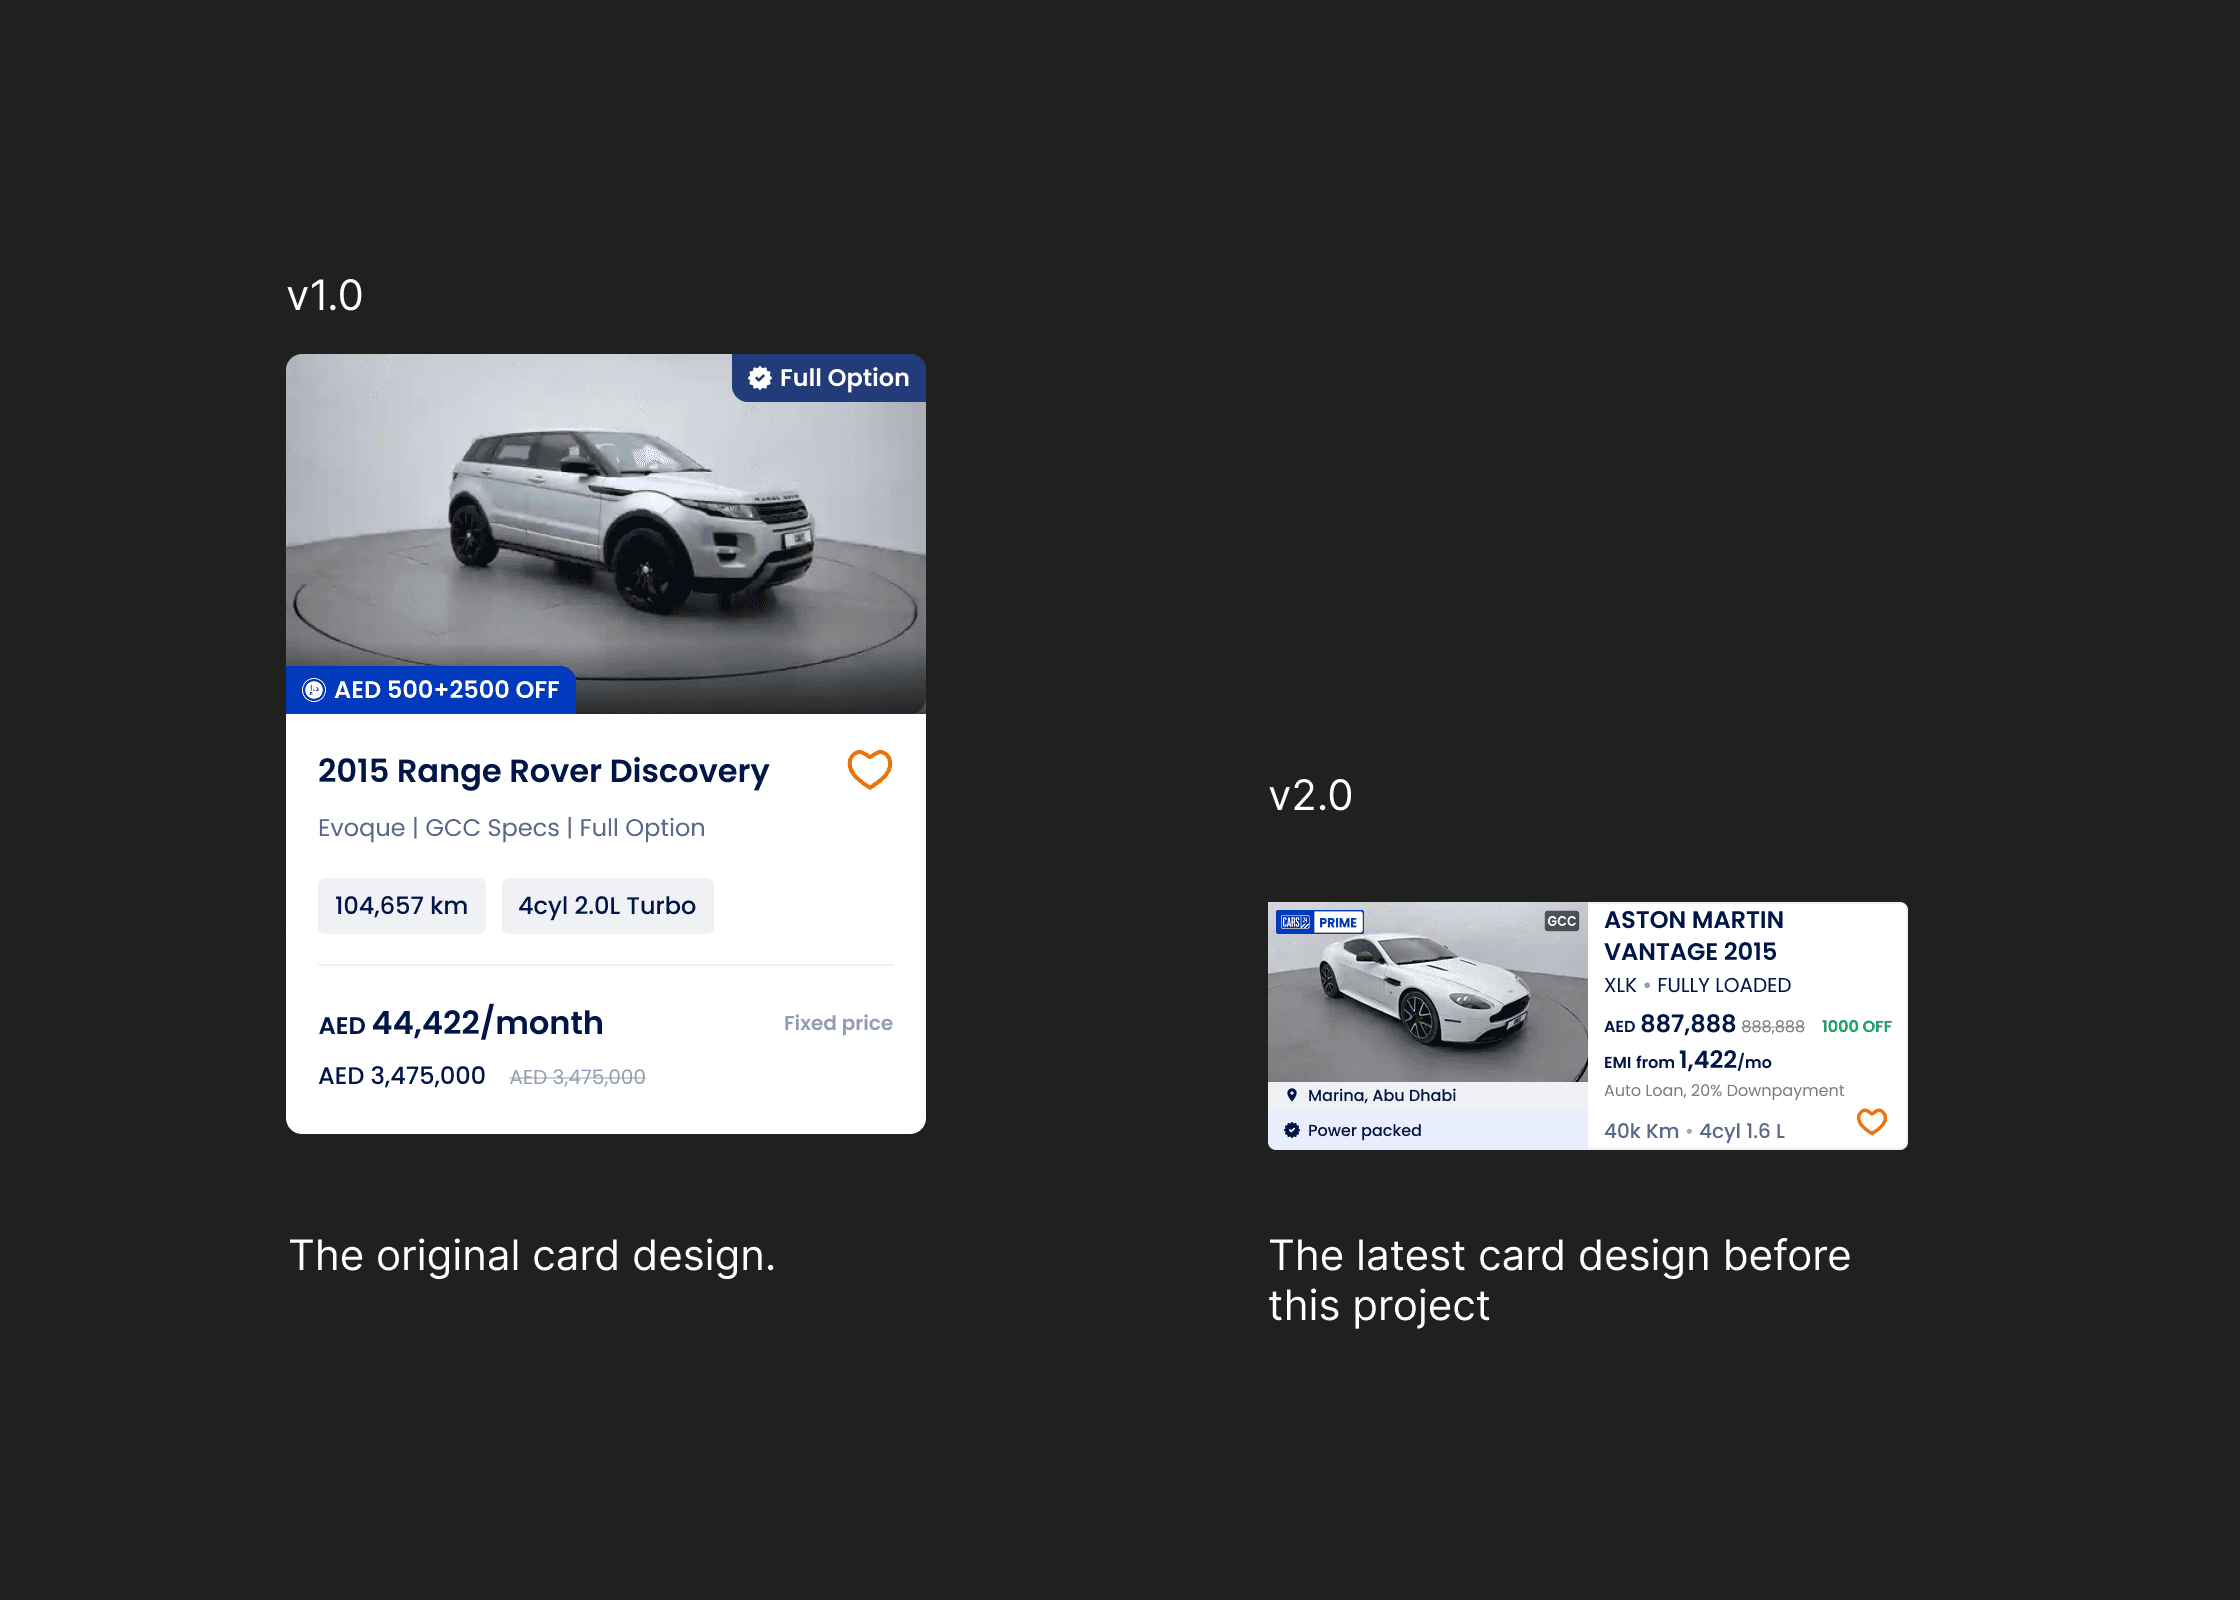
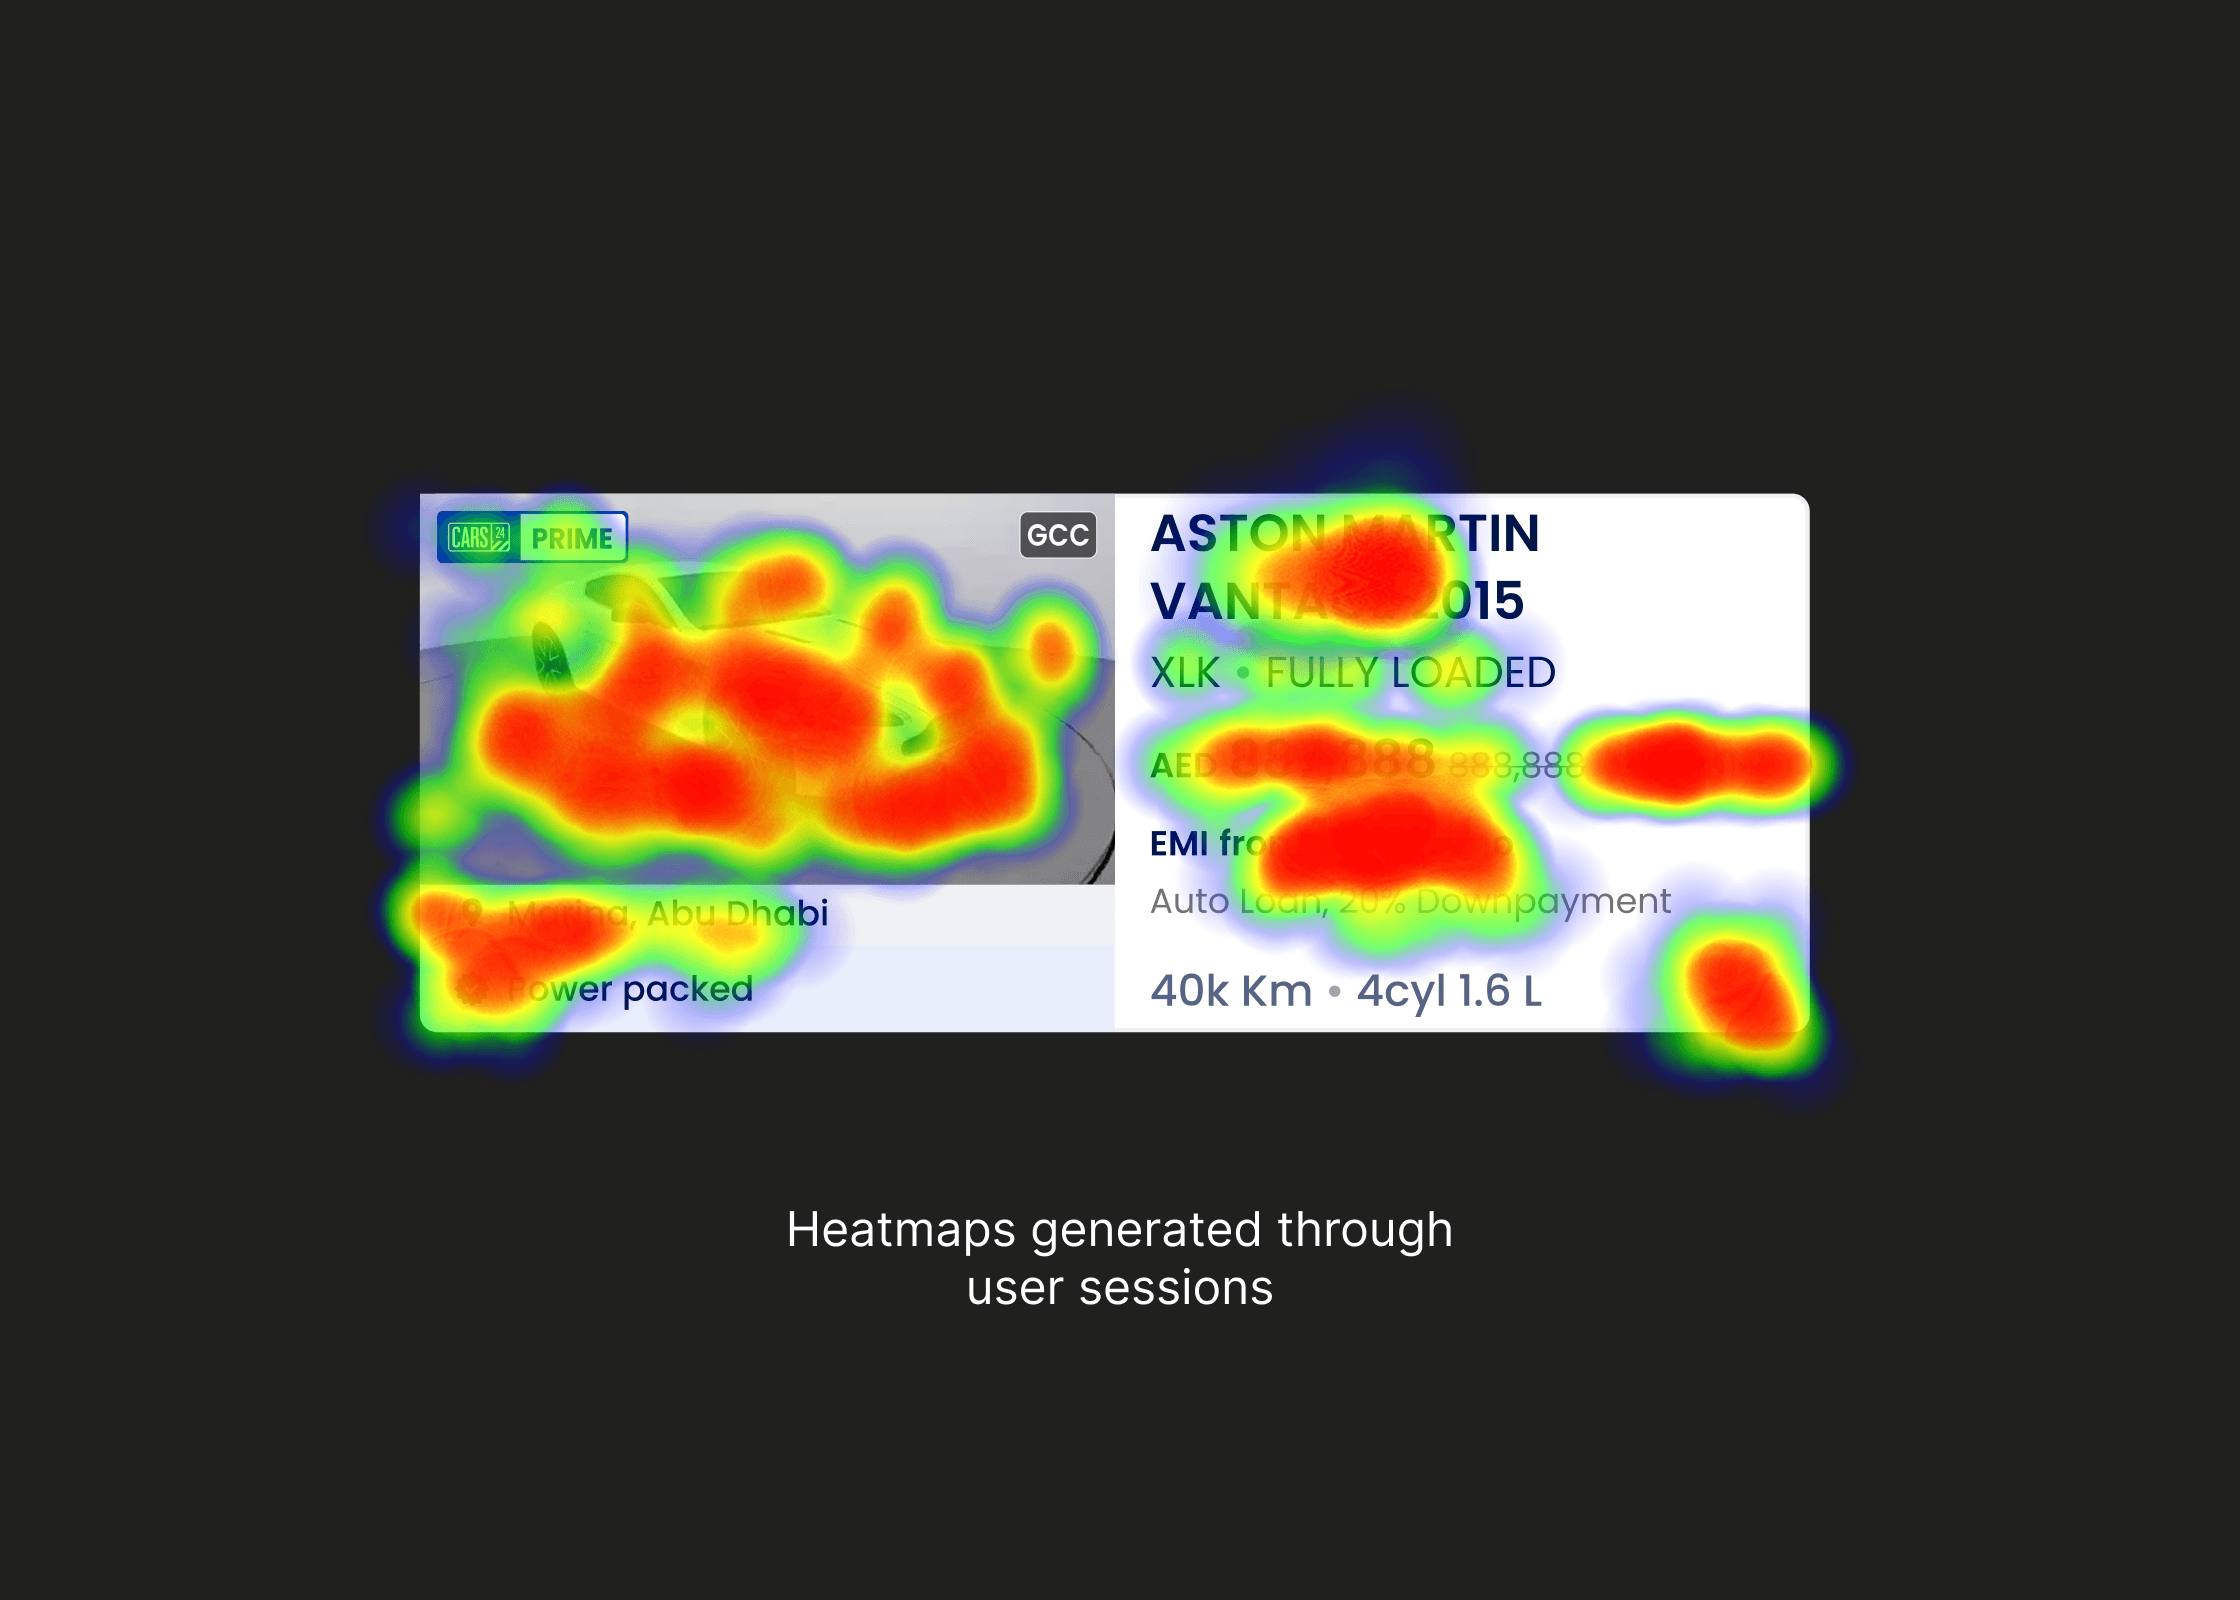

Cars24’s existing car cards on mobile optimised too aggressively for vertical space, leading to a loss of visual hierarchy—a friction point that risked abandonment and reduced discoverability. By analyzing heatmaps and user behavior, I identified an opportunity to let card layouts breathe a little, without sacrificing critical information (e.g., price, mileage, photos). Streamlining the design would enable users to scan information more comfortably.
Car Tags
The old classification system relied on colour-coded text tags, which lacked consistency and clarity, causing confusion for users and internal teams. Tags were often overlooked, and static category pages saw less than 4% engagement, indicating poor usability. This inefficiency presented an opportunity to redesign the system into a streamlined, intuitive solution that improved discoverability, navigation, and user engagement. By addressing these pain points, the redesign aimed to enhance both customer satisfaction and platform usability.
I hypothesised that replacing text-based tags with visual icons would improve recognition, recall, and clickability. Icons would reduce cognitive load, enabling users to quickly identify categories and locate preferred vehicles. This shift would streamline navigation, increase engagement, and enhance overall user satisfaction by making the platform more intuitive and efficient.
Static Pages
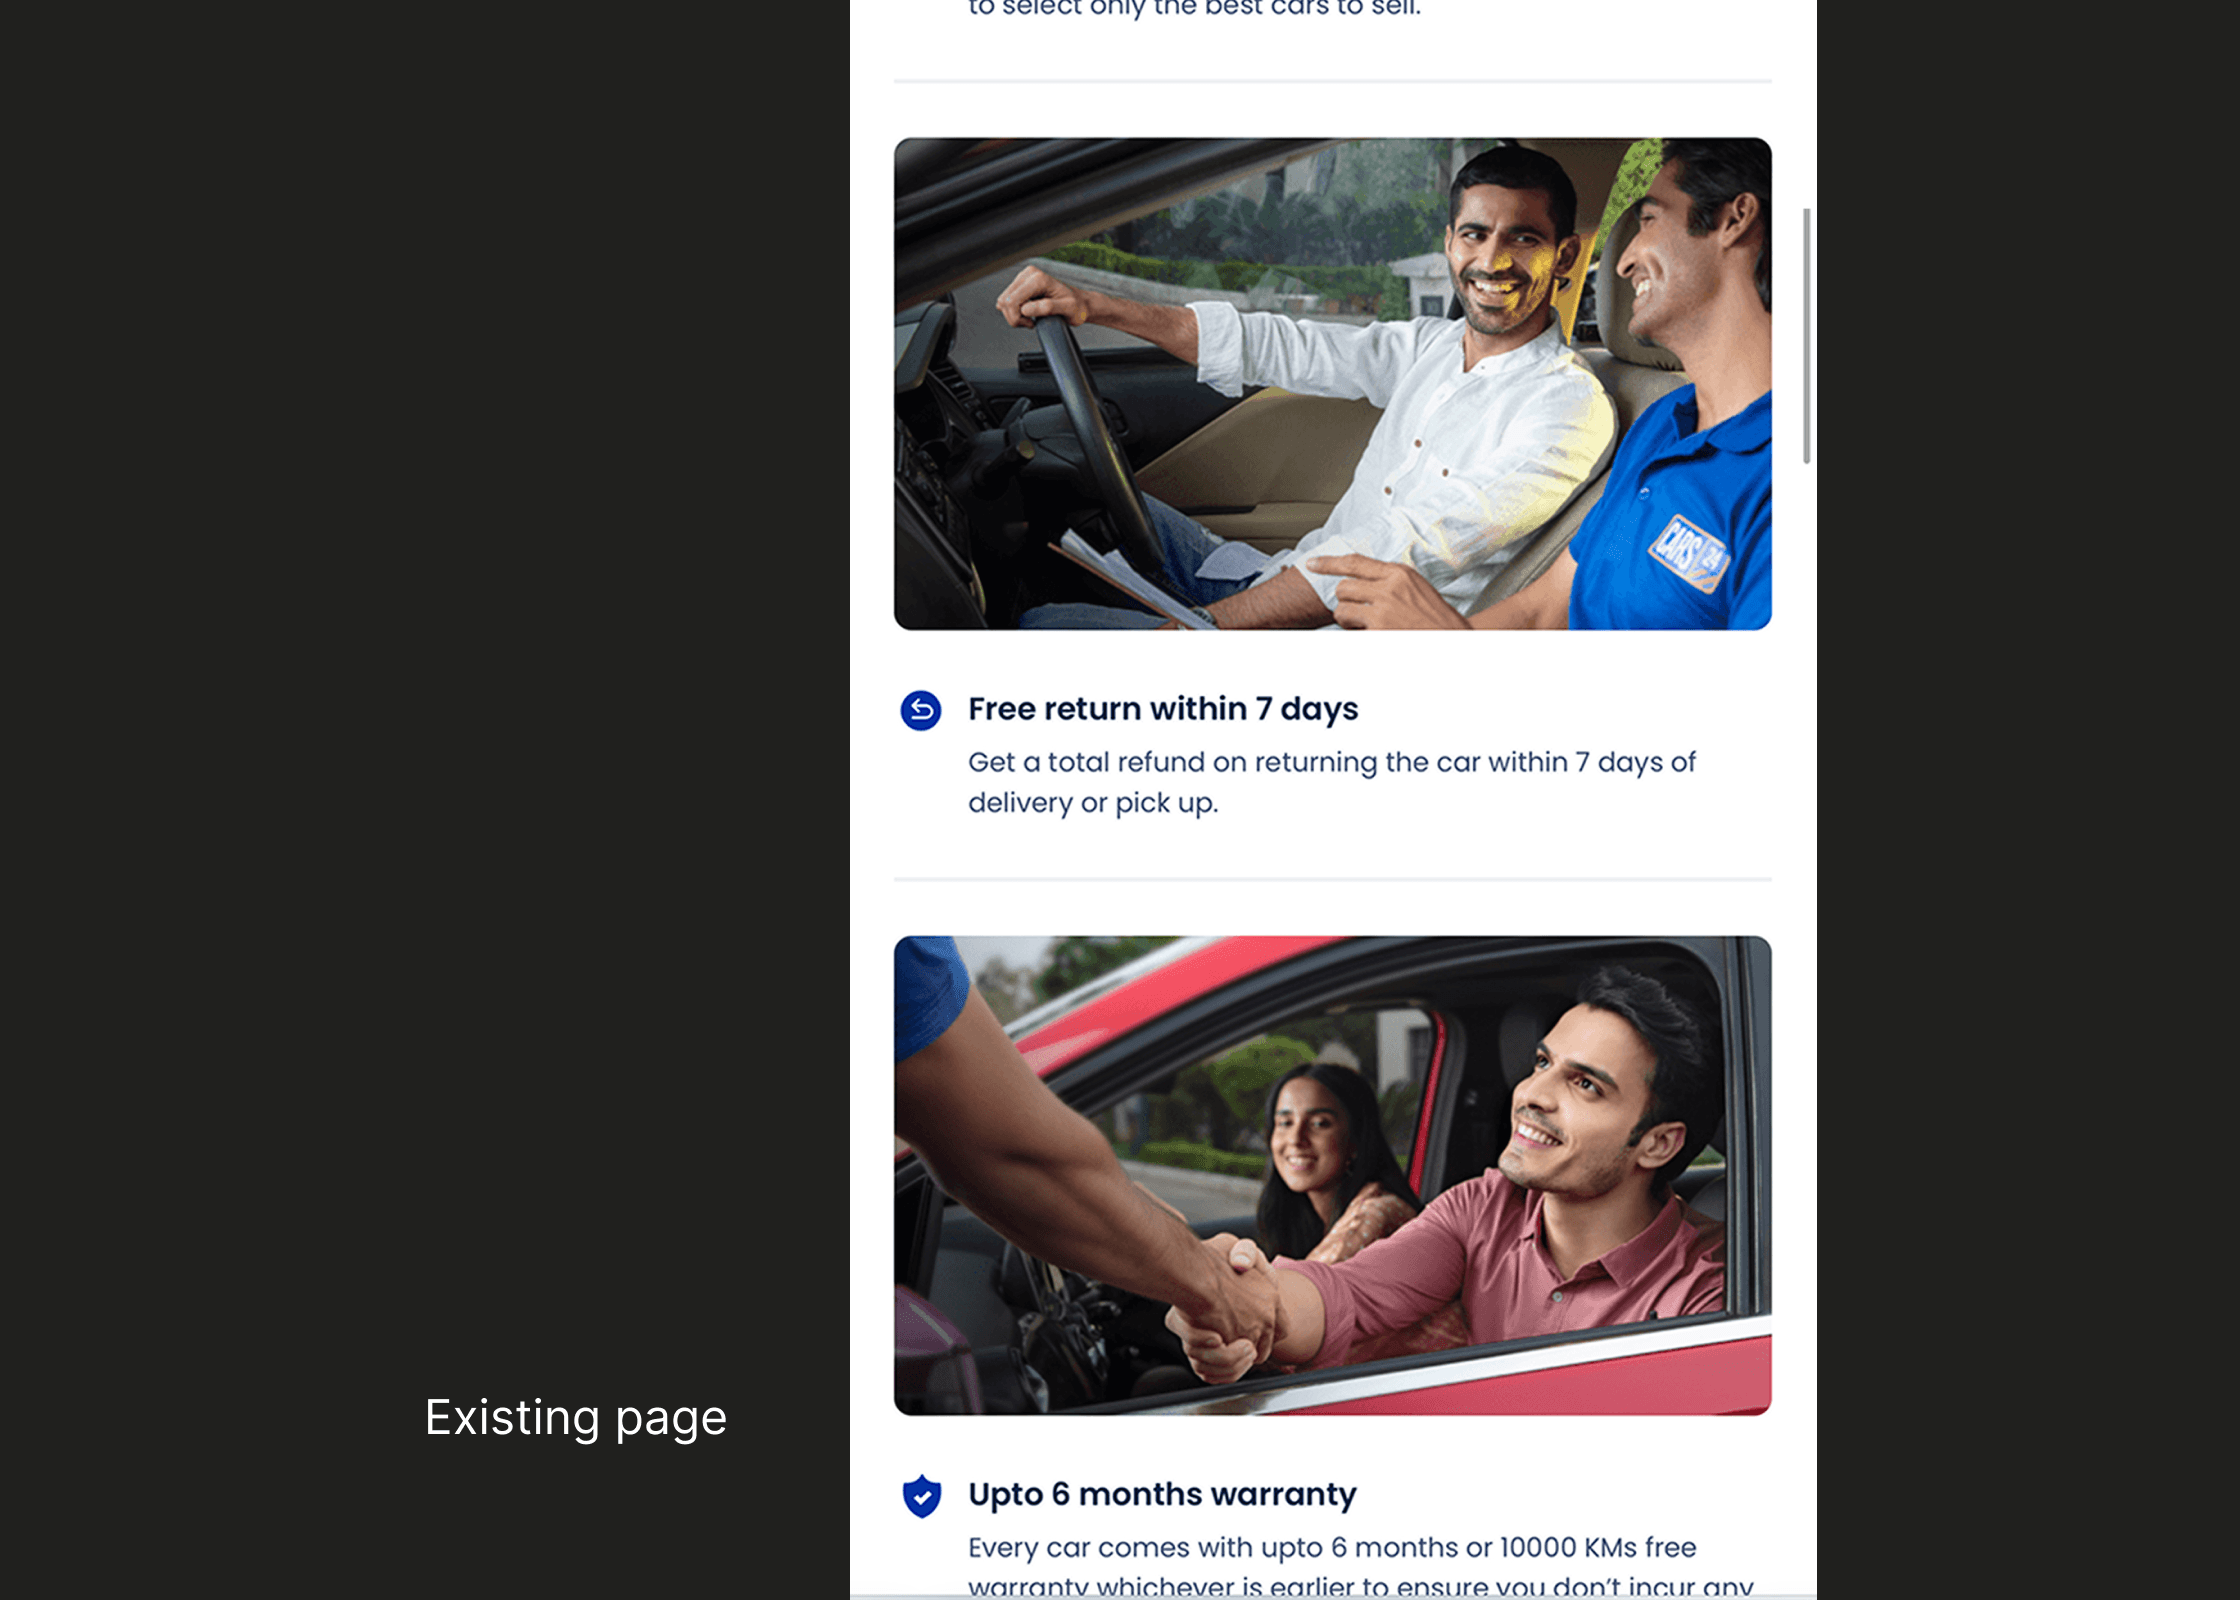

The existing static classification pages were text-heavy and overwhelming, causing users to skim or exit without engaging. Simplifying technical jargon and reducing content could nudge users toward exploration. Restructuring content around user relevance—using visual aids (icons, comparison charts) and progressive disclosure—would reduce cognitive load. Testing suggested that dynamic filters and clear value propositions would boost engagement and downstream metrics like detail page visits.
Impact
Car Cards

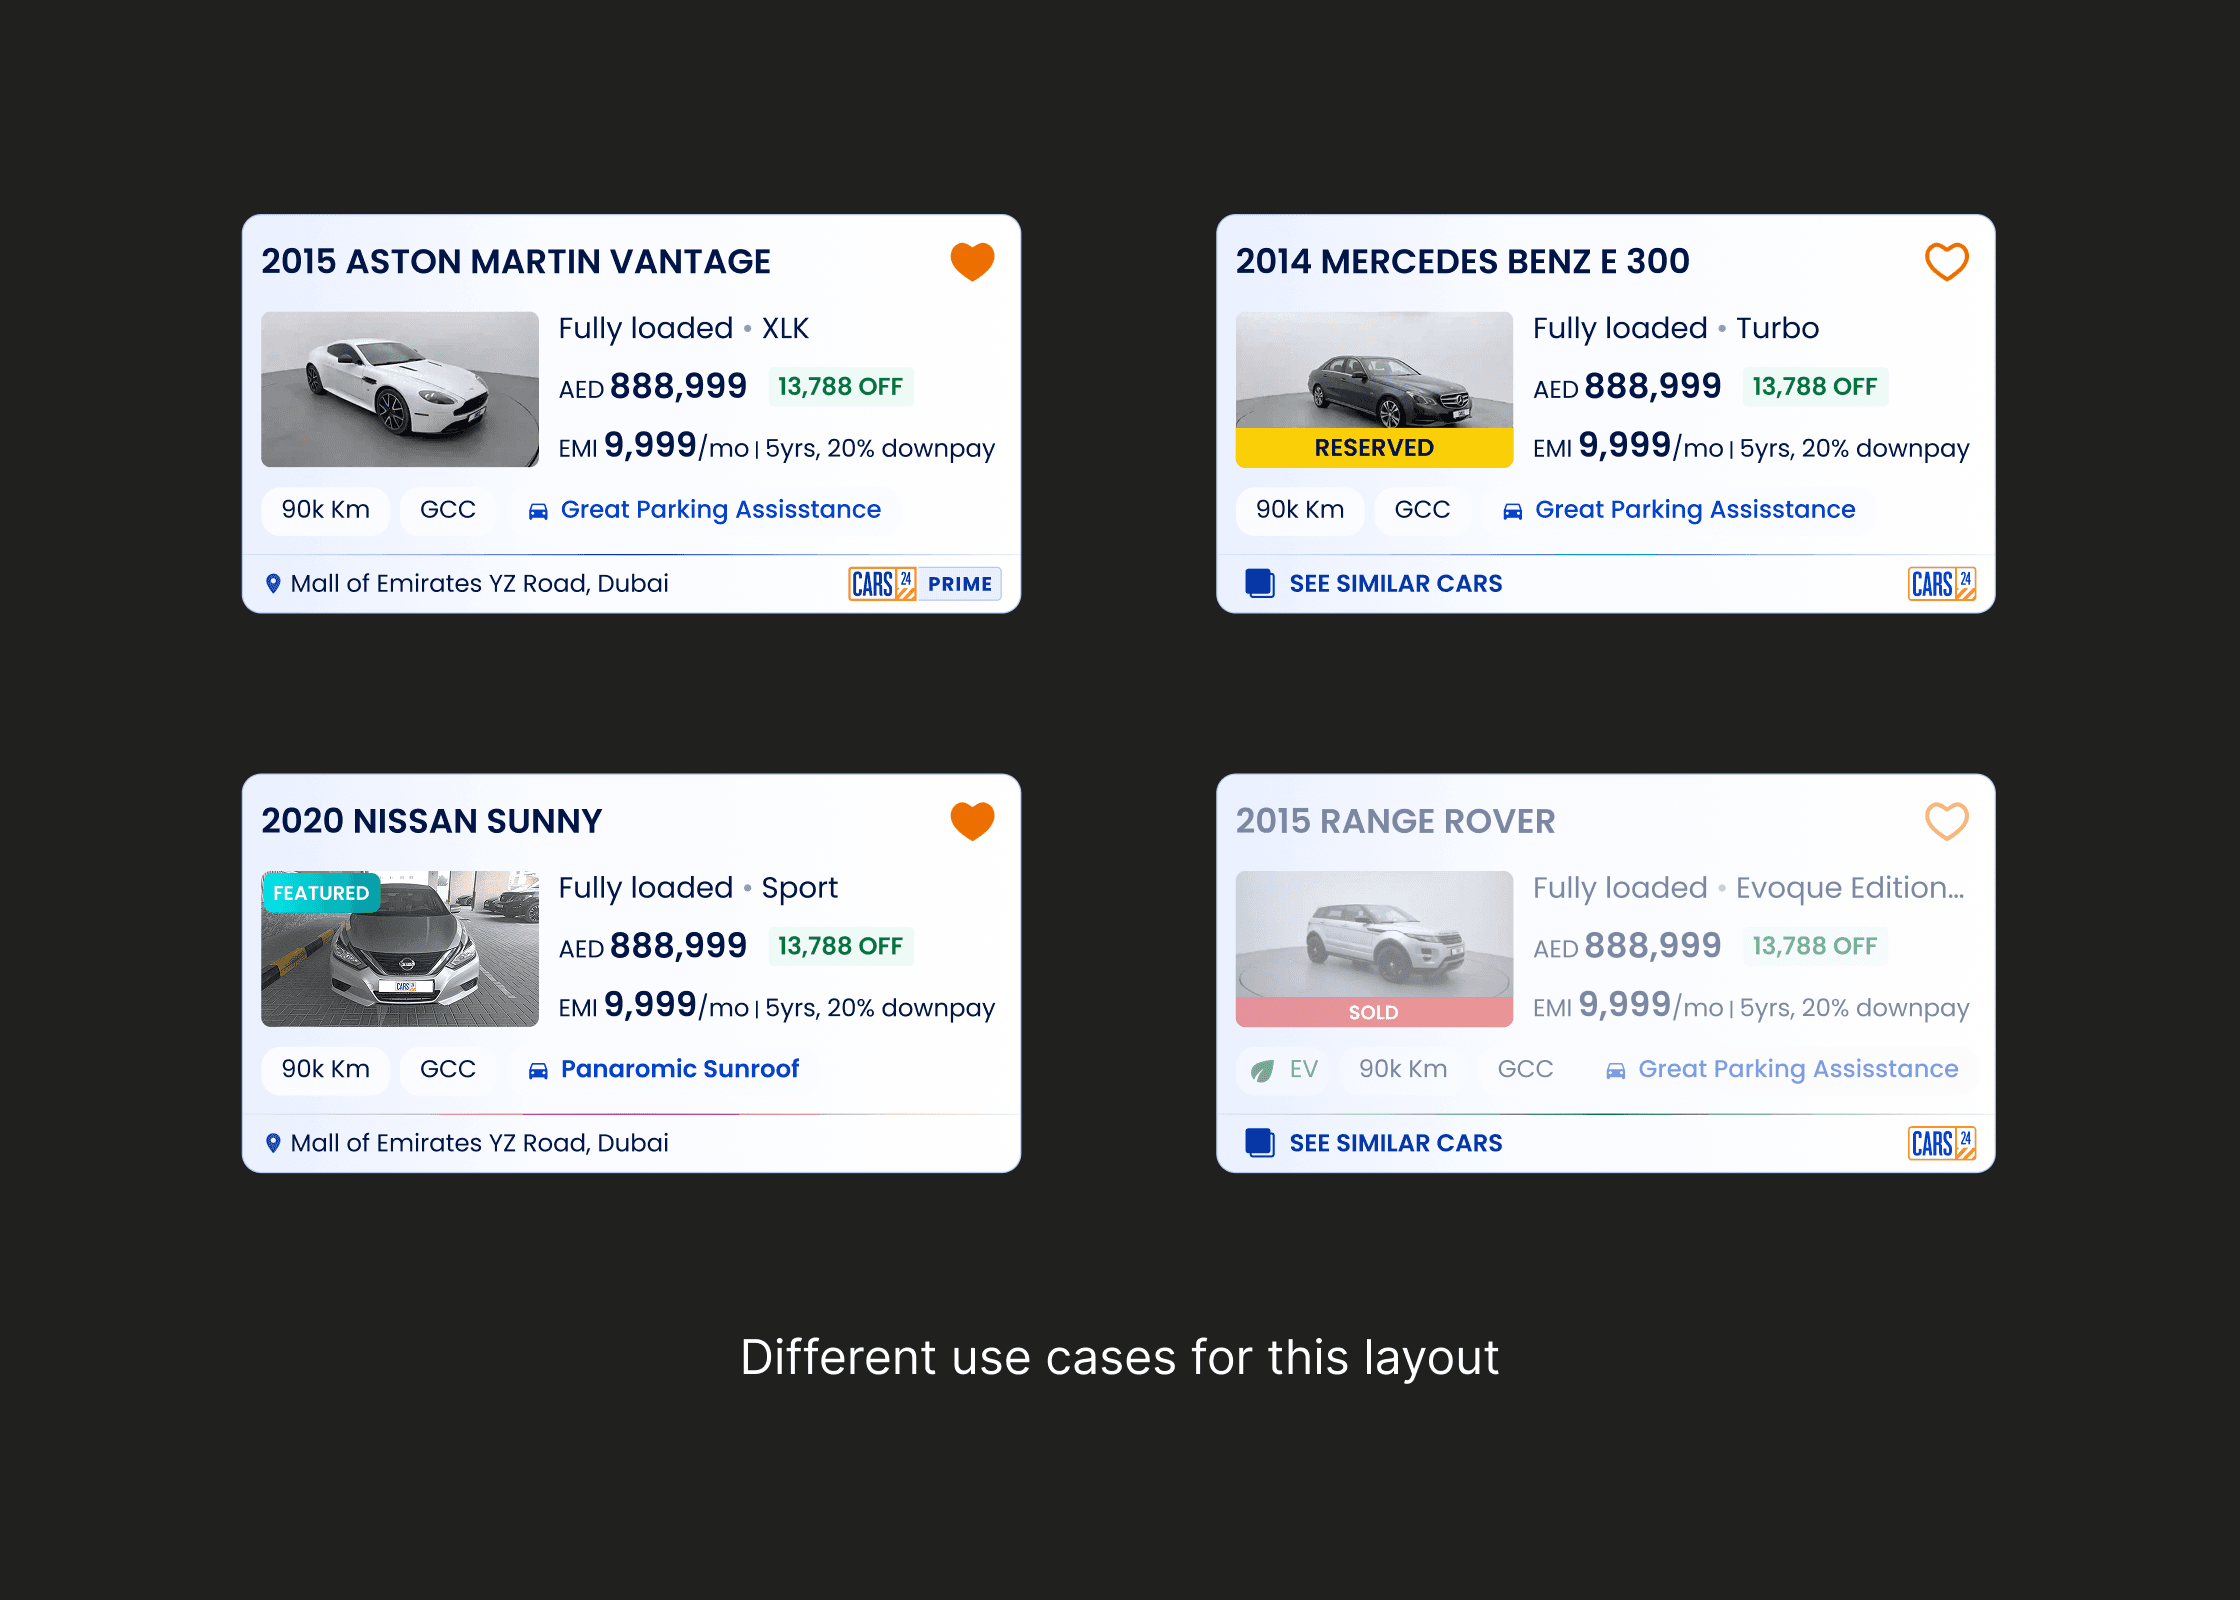
The redesigned cards drove a 26% increase in impressions per user, a 19% rise in detail page visits, and an 11% lift in booking intent—validating the hypothesis. Users spent less time scrolling and more time engaging with listings, reflecting reduced decision paralysis. Post-launch feedback highlighted improved ease of browsing. This outcome demonstrated that optimising information density, paired with clear visual hierarchy, directly enhances user experience.
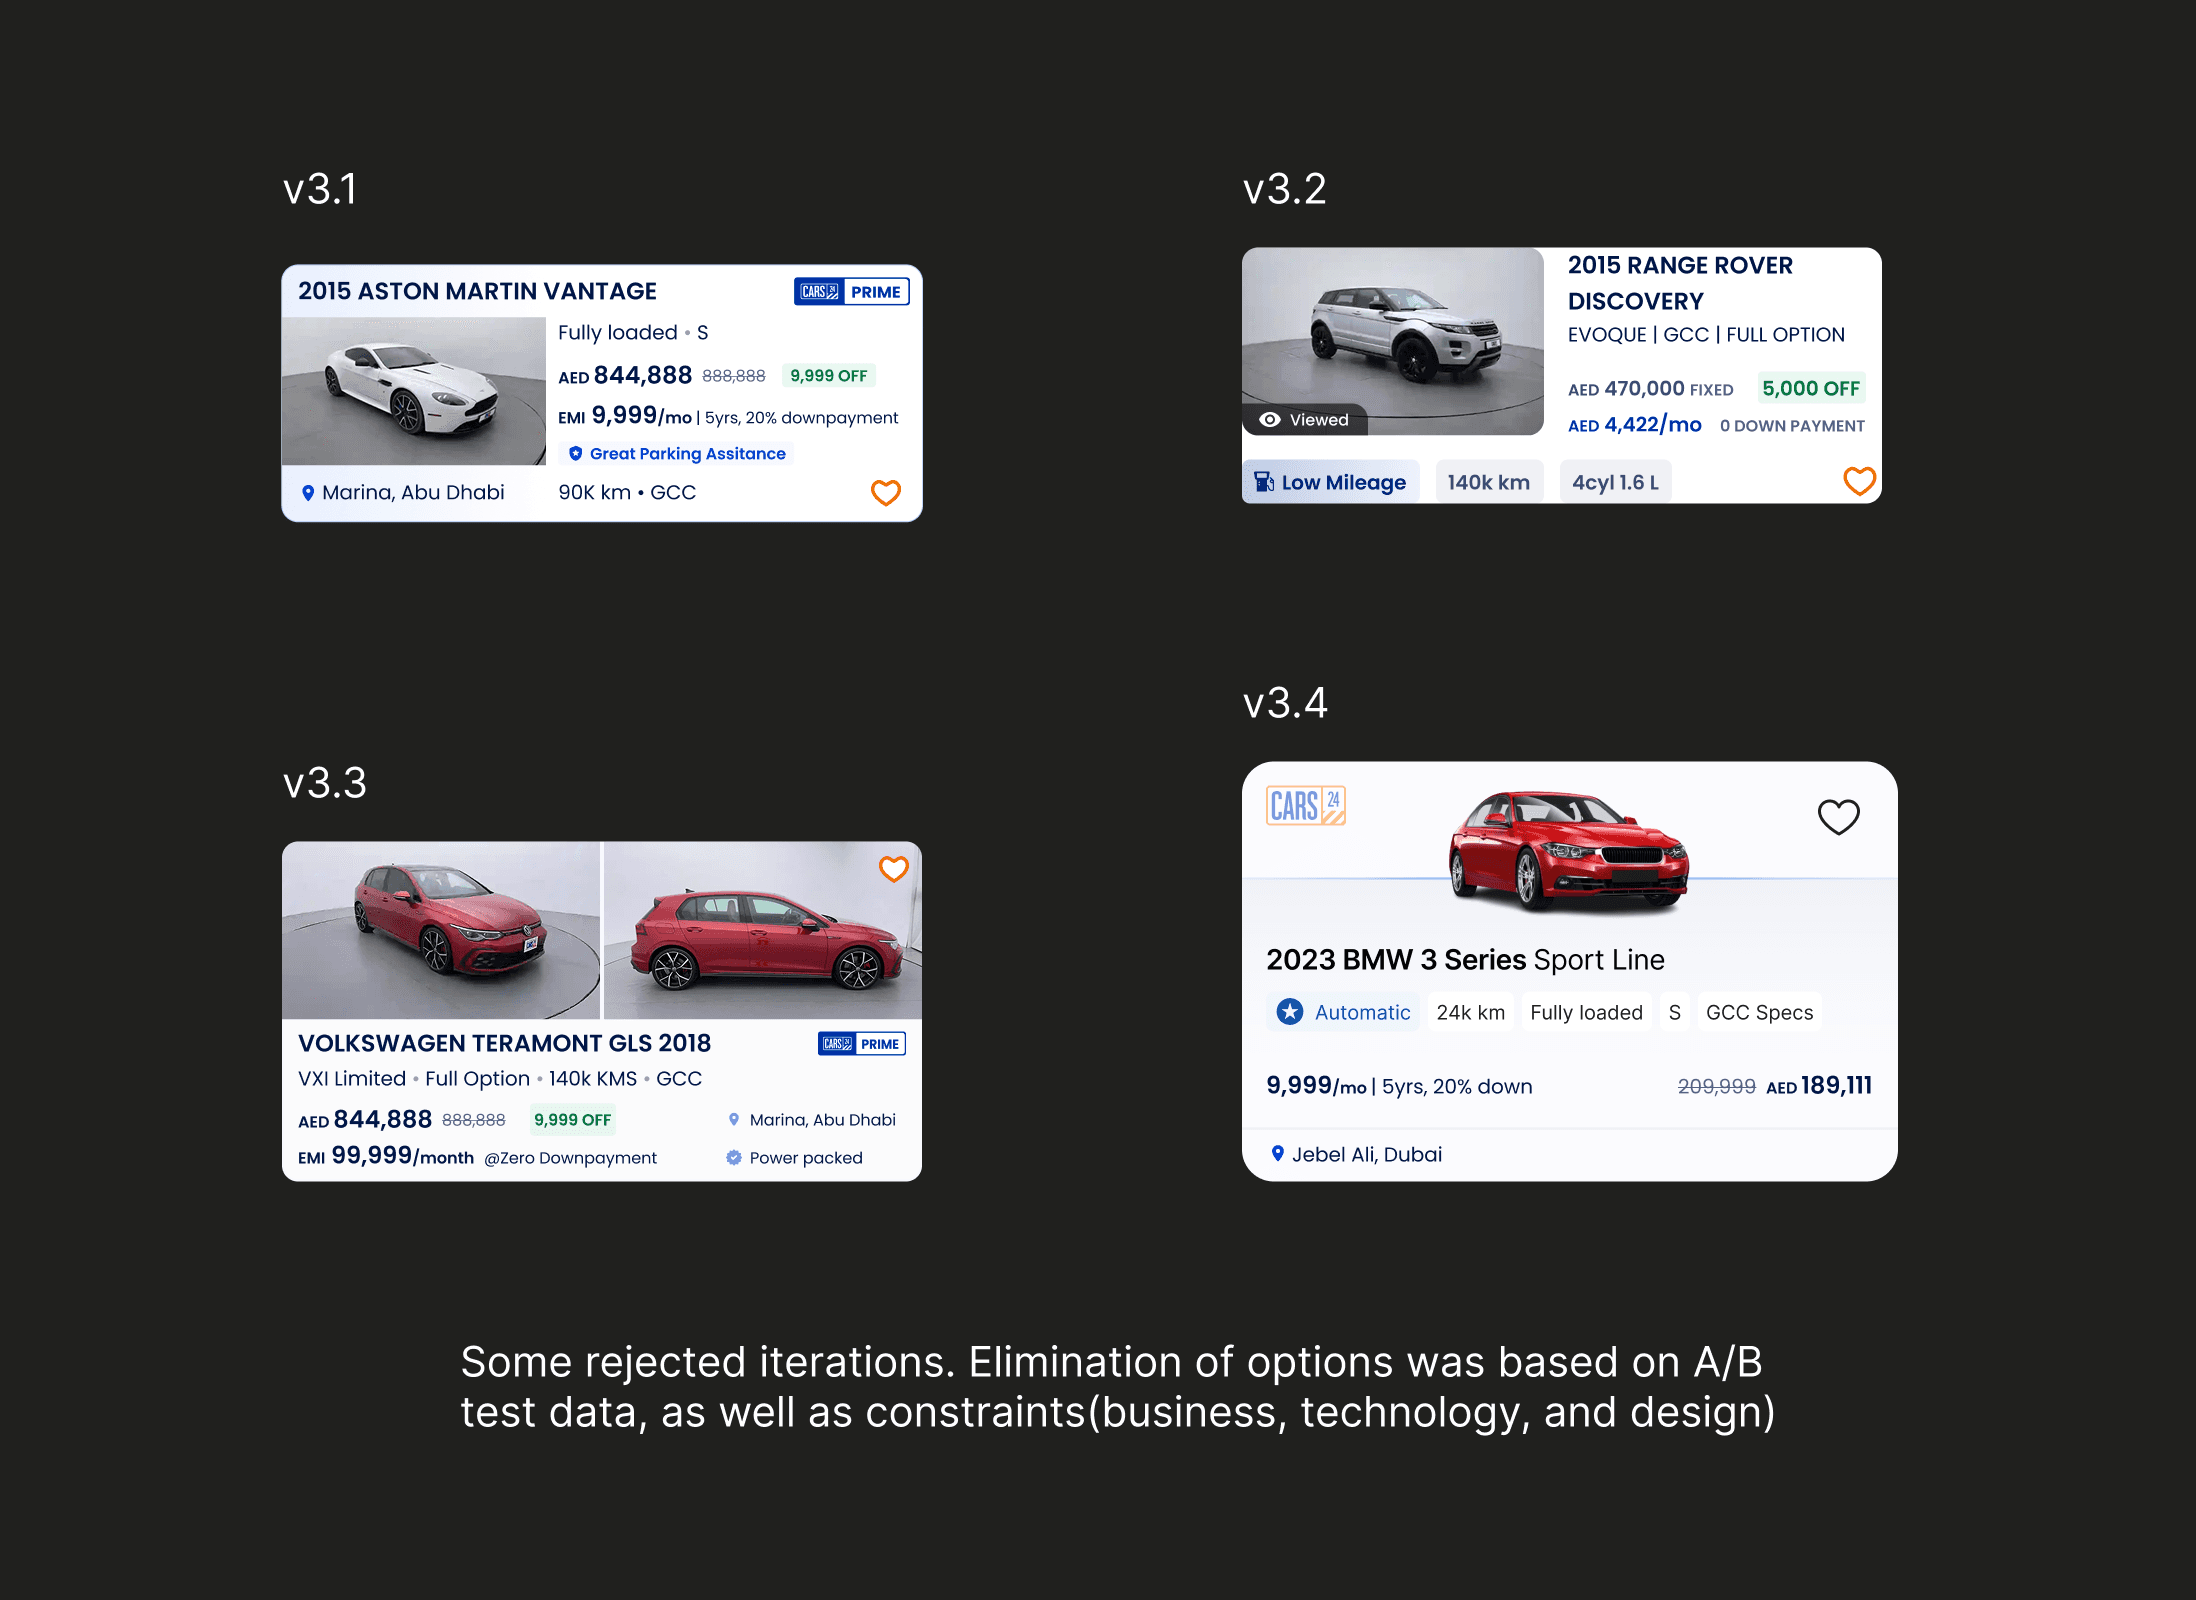
Of course, several rounds of iteration and exploration occurred before this (slideshow above) design was settled on. Business, regulatory, and development constraints did not allow for the more aesthetic and imaginative layouts.
Car Tags


In A/B testing, the new system drove a 15% increase in tag clicks and boosted static page views from 4% to 20% of visitors. Customer queries about tag meanings dropped by 28%, confirming improved clarity. The system was rolled out globally, enhancing engagement and usability while laying the foundation for further refinements.
I designed a comprehensive icon-based system, ensuring each icon clearly represented its category. Extensive user research and iterative testing refined the designs for simplicity and clarity. The final system prioritised visual consistency and ease of use, replacing cluttered text tags with minimal, recognisable icons. This approach aimed to enhance discoverability and navigation while reducing user confusion.
Static Pages


The redesign drove a 12% increase in booking intention, as visual cues and filters encouraged exploration. 60% of users scrolled for more information, indicating higher engagement. Additionally, 35% of users engaged with a second static page via the interactive comparison chart.
I executed the redesign by removing true-to-life pictures and replacing them with simpler icon-based imagery for each car type. I also reduced text density and reduced the benefits shown per category. This created a cleaner, more scannable layout, with interactive filters and contextual tooltips to simplify complex terms. The mobile-first design emphasised progressive disclosure, ensuring users could quickly grasp key information.
Recommendations
Comments from colleagues and friends
Parth's commitment to delivering good UX is note-worthy. I rarely see anyone dive as deep into consumer thought processes as he does.
Anthony Damien
Director, Solverminds Solutions
An employee I don't have to micromanage. Parth's leadership in creating our design system from scratch ensure the process was smooth and efficient. His experience and attention to detail always exceeds expectations.
Medha Kadian
Lead Designer, Enphase Energy
Parth created extremely well-thought user journeys for the interface of an additive manufacturing project here at Oracle. Would work with him again, anytime.
Navneet Kapur
Director, Oracle
I was genuinely surprised Parth has no formal background in product management and growth. His intuition and design sense has been proved right time and again, backed by hard data.
Gurmeet Singh
Product Manager, Cars24
B2C
Growth
Shipped
Improving car cards
An overhaul of the car cards, how cars are classified, and how each subcategory's benefits are presented to the customer, relying on recognition over recall.
Opportunity
Redesigning the car cards, car tags, and static pages addresses key usability challenges by streamlining visual hierarchy, classification, and content clarity. Our research revealed that overly compact car cards obscure critical details, while inconsistent, color-coded tags and text-heavy static pages confuse users and hinder engagement. By rebalancing space on car cards, creating a coherent, intuitive tagging system, and simplifying static pages with user-relevant visuals and progressive disclosure, the redesign aims to enhance discoverability and navigation.
Outcome
The redesigned car cards increased impressions per user by 26%, detail page visits by 19%, and booking intent by 11%, reducing decision paralysis and improving browsing efficiency. While iterations balanced aesthetics with business and regulatory constraints, user feedback confirmed enhanced usability. The new tagging system boosted tag clicks by 145% and increased static page views from 4% to 23%, with customer queries about tag meanings dropping 31%, validating improved clarity. Redesigned static pages led to a 12% rise in booking intent, with 60% of users scrolling for more details and 35% engaging with multiple pages, showing improved discoverability and navigation.
Industry
Lead
Headquarters
3 months
Founded
Research + sprint
Company size
3
145%
more clicks on tags
23%
increase in bookings initiated
60%
more static page visits
Car Cards
Cars24’s existing car cards on mobile optimised too aggressively for vertical space, leading to a loss of visual hierarchy—a friction point that risked abandonment and reduced discoverability. By analyzing heatmaps and user behavior, I identified an opportunity to let card layouts breathe a little, without sacrificing critical information (e.g., price, mileage, photos). Streamlining the design would enable users to scan information more comfortably.
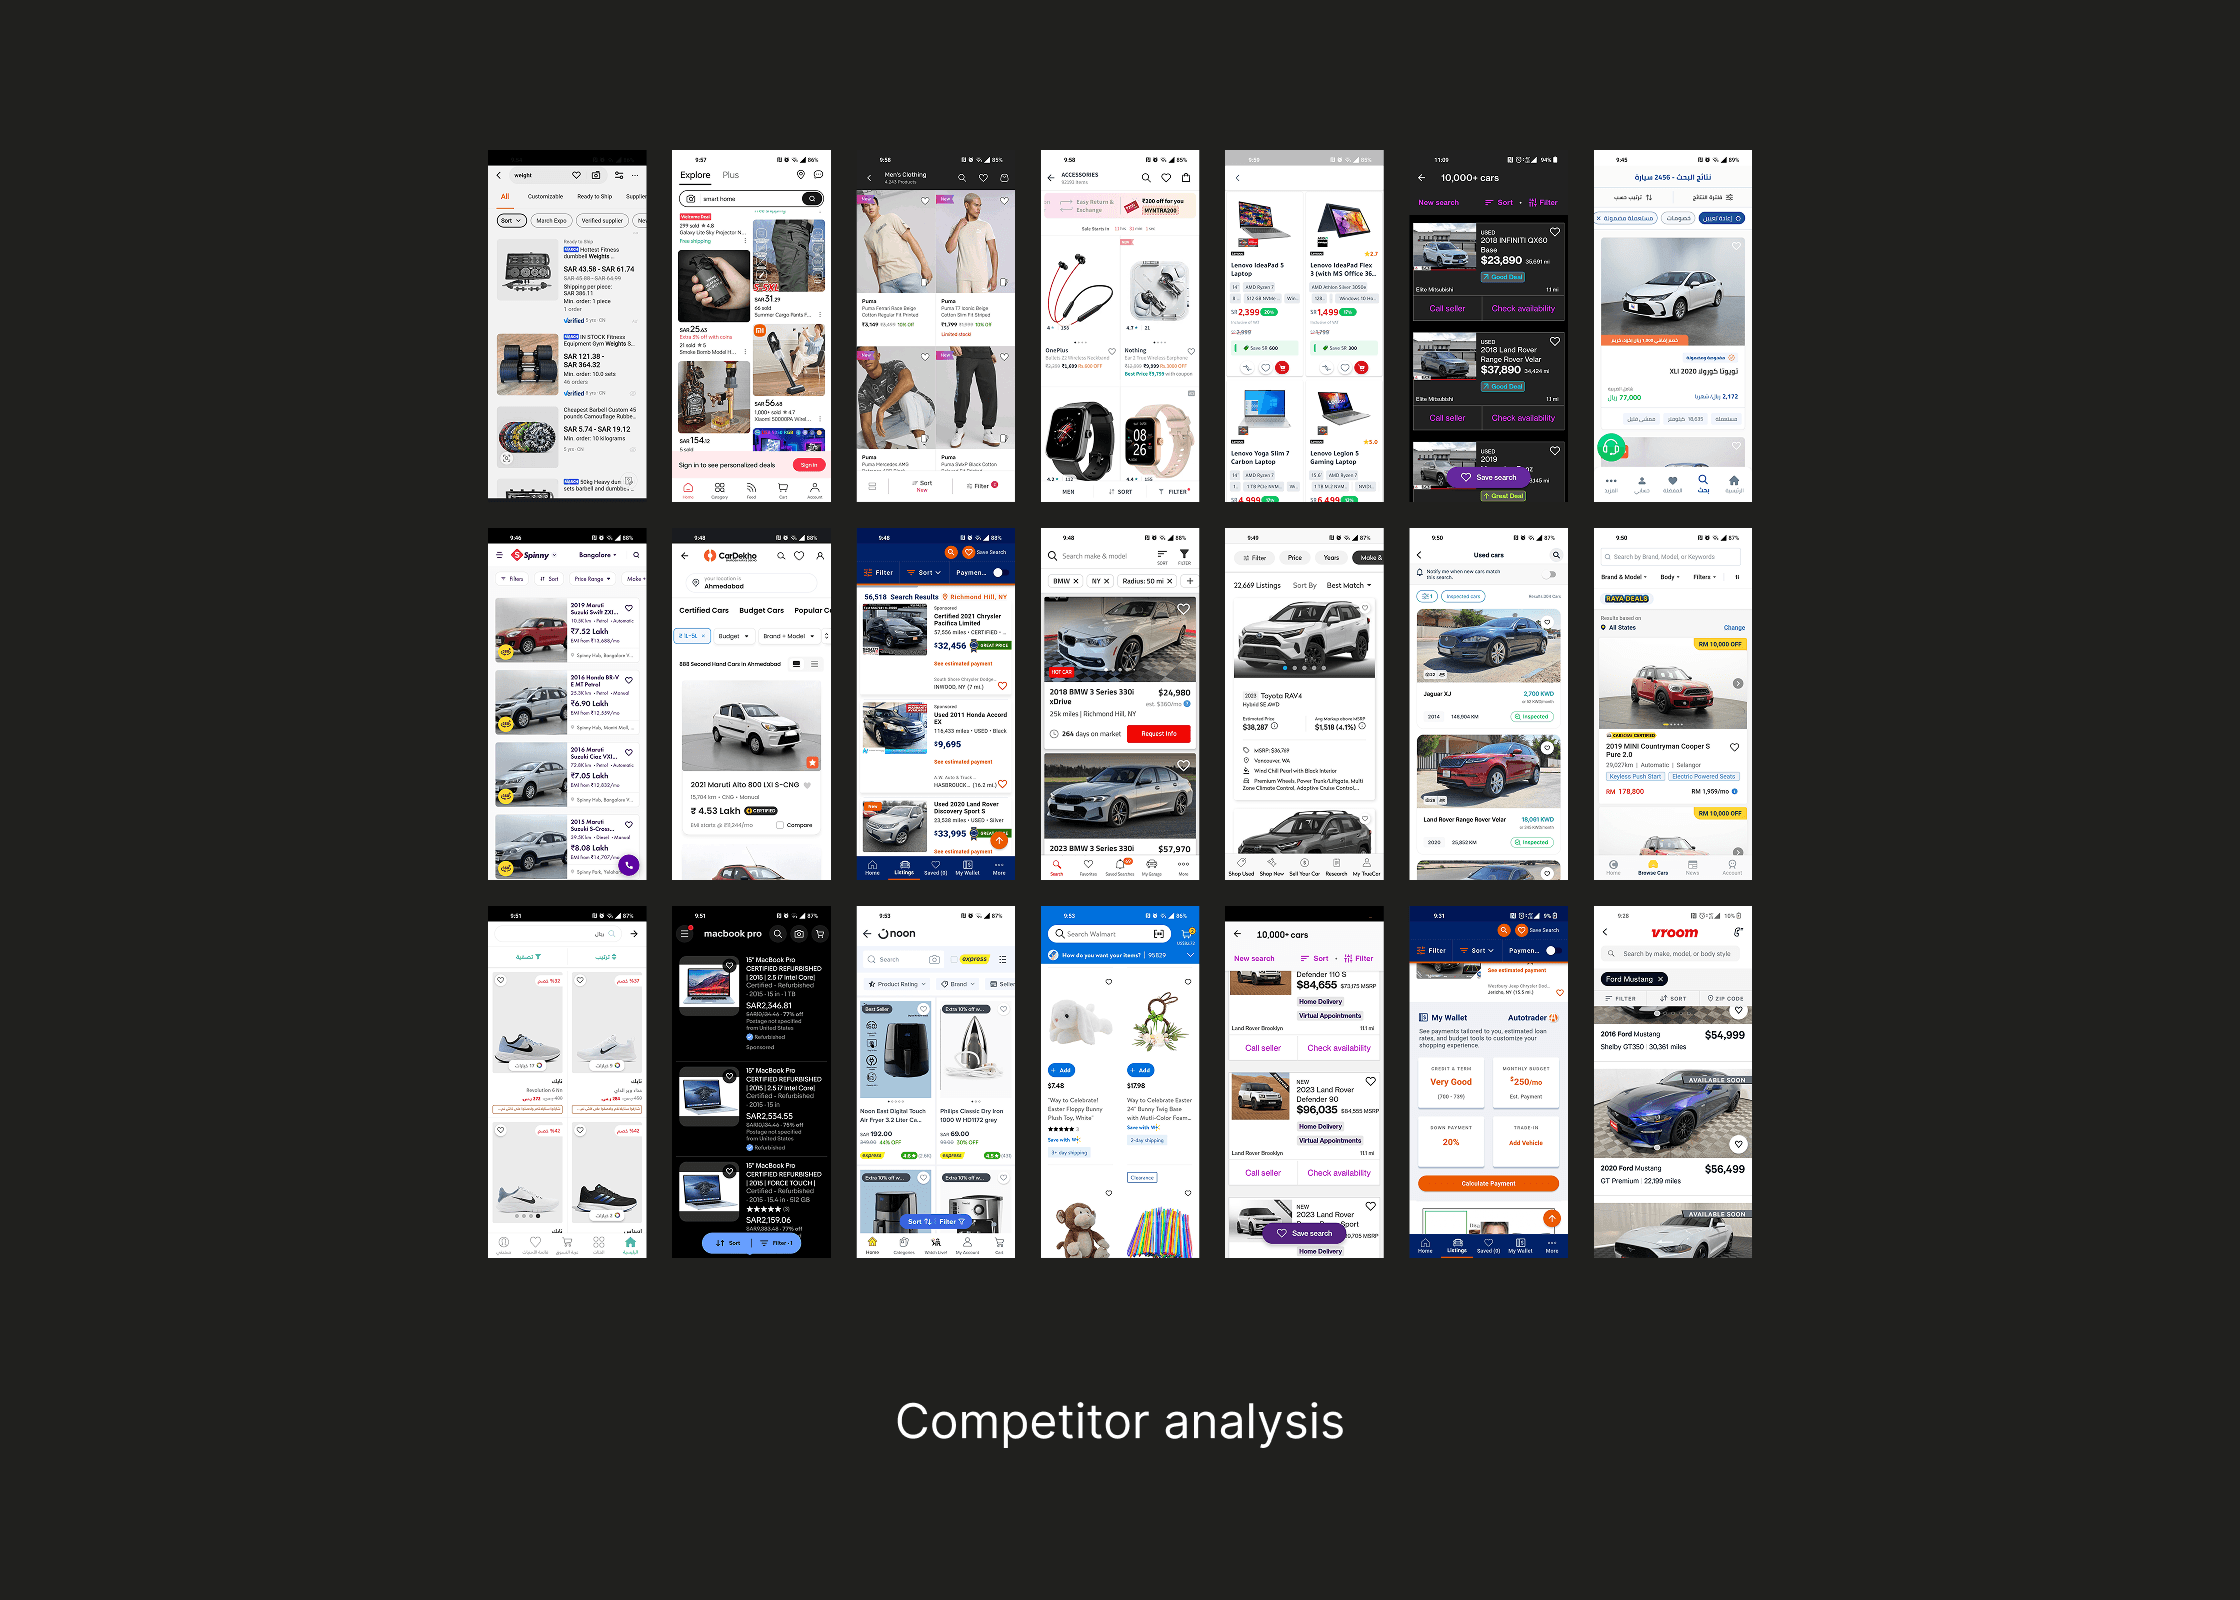
This can be a grid/slide show of all the research around the car cards: Heatmaps, Layout study, Benchmarking, iterations
Car Tags
The old classification system relied on colour-coded text tags, which lacked consistency and clarity, causing confusion for users and internal teams. Tags were often overlooked, and static category pages saw less than 4% engagement, indicating poor usability. This inefficiency presented an opportunity to redesign the system into a streamlined, intuitive solution that improved discoverability, navigation, and user engagement. By addressing these pain points, the redesign aimed to enhance both customer satisfaction and platform usability.
I hypothesised that replacing text-based tags with visual icons would improve recognition, recall, and clickability. Icons would reduce cognitive load, enabling users to quickly identify categories and locate preferred vehicles. This shift would streamline navigation, increase engagement, and enhance overall user satisfaction by making the platform more intuitive and efficient.
This can be a grid/slide show of all the research around the car cards: Heatmaps, Layout study, Benchmarking, iterations
Static Pages
The existing static classification pages were text-heavy and overwhelming, causing users to skim or exit without engaging. Simplifying technical jargon and reducing content could nudge users toward exploration. Restructuring content around user relevance—using visual aids (icons, comparison charts) and progressive disclosure—would reduce cognitive load. Testing suggested that dynamic filters and clear value propositions would boost engagement and downstream metrics like detail page visits.
This can be a grid/slide show of all the research around the car cards: Heatmaps, Layout study, Benchmarking, iterations
Process
Car Cards
This can be a grid/slide show of all the research around the car cards: Heatmaps, Layout study, Benchmarking, iterations
The redesigned cards drove a 26% increase in impressions per user, a 19% rise in detail page visits, and an 11% lift in booking intent—validating the hypothesis. Users spent less time scrolling and more time engaging with listings, reflecting reduced decision paralysis. Post-launch feedback highlighted improved ease of browsing. This outcome demonstrated that optimising information density, paired with clear visual hierarchy, directly enhances user experience.
Of course, several rounds of iteration and exploration occurred before this (slideshow above) design was settled on. Business, regulatory, and development constraints did not allow for the more aesthetic and imaginative layouts.
Car Tags
This can be a grid/slide show of all the research around the car cards: Heatmaps, Layout study, Benchmarking, iterations
In A/B testing, the new system drove a 15% increase in tag clicks and boosted static page views from 4% to 20% of visitors. Customer queries about tag meanings dropped by 28%, confirming improved clarity. The system was rolled out globally, enhancing engagement and usability while laying the foundation for further refinements.
I designed a comprehensive icon-based system, ensuring each icon clearly represented its category. Extensive user research and iterative testing refined the designs for simplicity and clarity. The final system prioritised visual consistency and ease of use, replacing cluttered text tags with minimal, recognisable icons. This approach aimed to enhance discoverability and navigation while reducing user confusion.
Static Pages
The redesign drove a 12% increase in booking intention, as visual cues and filters encouraged exploration. 60% of users scrolled for more information, indicating higher engagement. Additionally, 35% of users engaged with a second static page via the interactive comparison chart.
I executed the redesign by removing true-to-life pictures and replacing them with simpler icon-based imagery for each car type. I also reduced text density and reduced the benefits shown per category. This created a cleaner, more scannable layout, with interactive filters and contextual tooltips to simplify complex terms. The mobile-first design emphasised progressive disclosure, ensuring users could quickly grasp key information.
This can be a grid/slide show of all the research around the car cards: Heatmaps, Layout study, Benchmarking, iterations
Impact
Reflections
1. st
2. nd
3. rd thing i learnt
Context
Car cards are the first point of contact a user has with the platform. The information presented here poses unique constraints - the more cars the user sees, the more likely they are to buy a car - leading to the conclusion that vertical space occupied by a card should be minimised. However, business, marketing, legal, and tech constraints require certain information to be present as a minimum. With not much freedom to cull information, layout of the car car was our first priority.
The tag system originally comprised five categories: Cars24 Prime, Cars24 Green, Cars24 Lite, Private Seller, and Private Seller Pro. Confused? You're not alone. Each tag was associated with a unique colour - relying on recall rather than recognition. This added cognitive load to the user, without any perceived benefit. Simplifying the tag system became the second method to improve experience.
Static pages were the simplest - with strict legal requirements for certain terminology and specific callouts to be present on the page, I only had the freedom to improve the visual design. Reducing the number of USP's. and replacing photos with icons gave the page some much-needed breathing space. This became the final piece in our proverbial puzzle.
Problem statement
1. For Car Cards: To improve readability and visual hierarchy of information. More clickable car tags.
2. For Car Tags : To simplify the categorisation system, and let users filter the best cars on Cars24.
3. For Static pages: To make static pages more visually appealing, and simplify information.
Recommendations
Comments from colleagues and friends
Parth's commitment to delivering good UX is note-worthy. I rarely see anyone dive as deep into consumer thought processes as he does.
Anthony Damien
Director, Solverminds Solutions
A designer who combines data-driven insights with creativity to deliver results. Parth's work on download nudges and login flows achieved measurable improvements in engagement, turning analysis into action.
Zuberan Ahmed
Principal Designer, Cars24
An employee I don't have to micromanage. Parth's leadership in creating our design system ensured the process was smooth and efficient. His experience and attention to detail always exceeds expectations.
Medha Kadian
Lead Designer, Enphase Energy
Parth created extremely well-thought user journeys for the interface of an additive manufacturing project here at Oracle. Would work with him again, anytime.
Navneet Kapur
Director, Oracle
I was genuinely surprised Parth has no formal background in product management and growth. His intuition has been proved right time and again, backed by hard data.
Gurmeet Singh
Product Manager, Cars24